
Free Analysis Dashboard
By folks at Tankrich
I wanted to create a dashboard in under 1 min by uploading from data amazing website www.screener.in , it’s built and now available to all of you
A comprehensive, fundamental analysis tool for equity research. Upload Excel files from screener.in (note you need to use their basic file, so if you use custom file please change it)
Before using tool do this while logged in
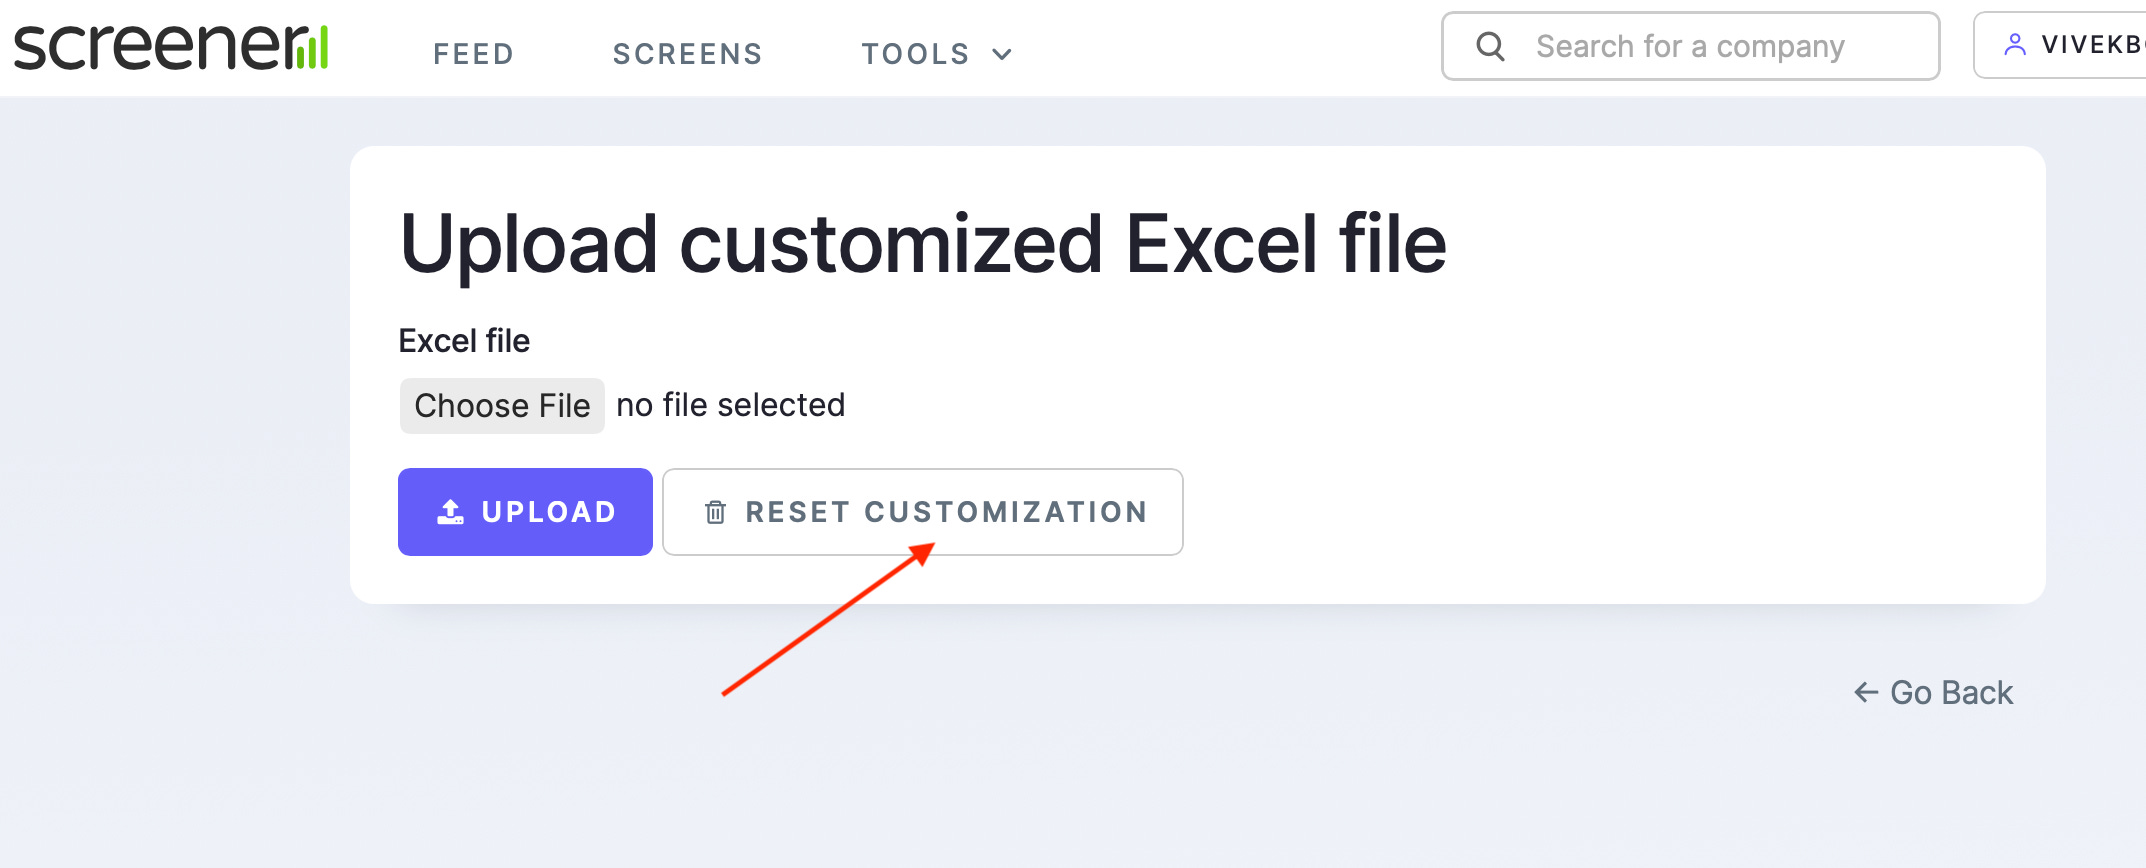
go to https://www.screener.in/excel/
click RESET customisation

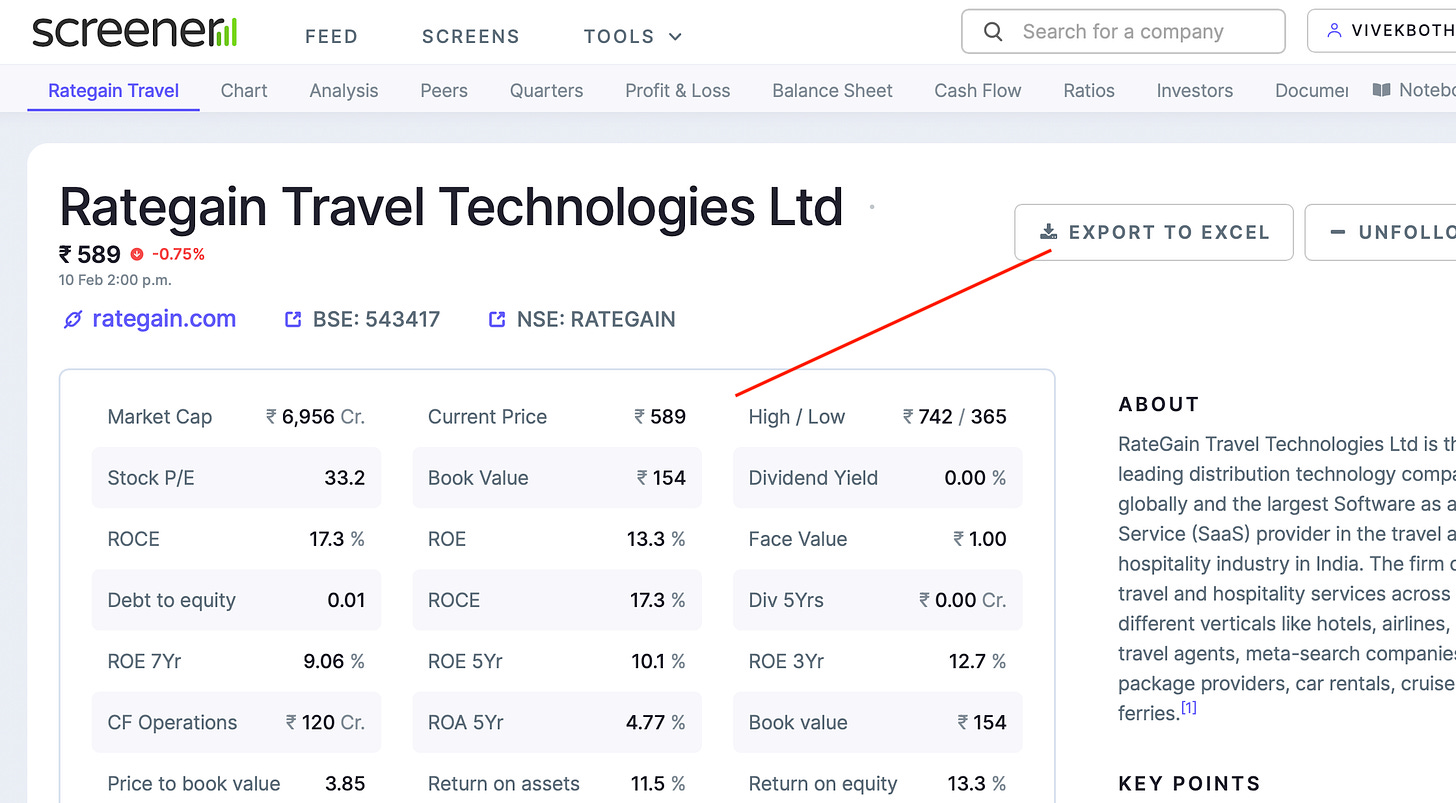
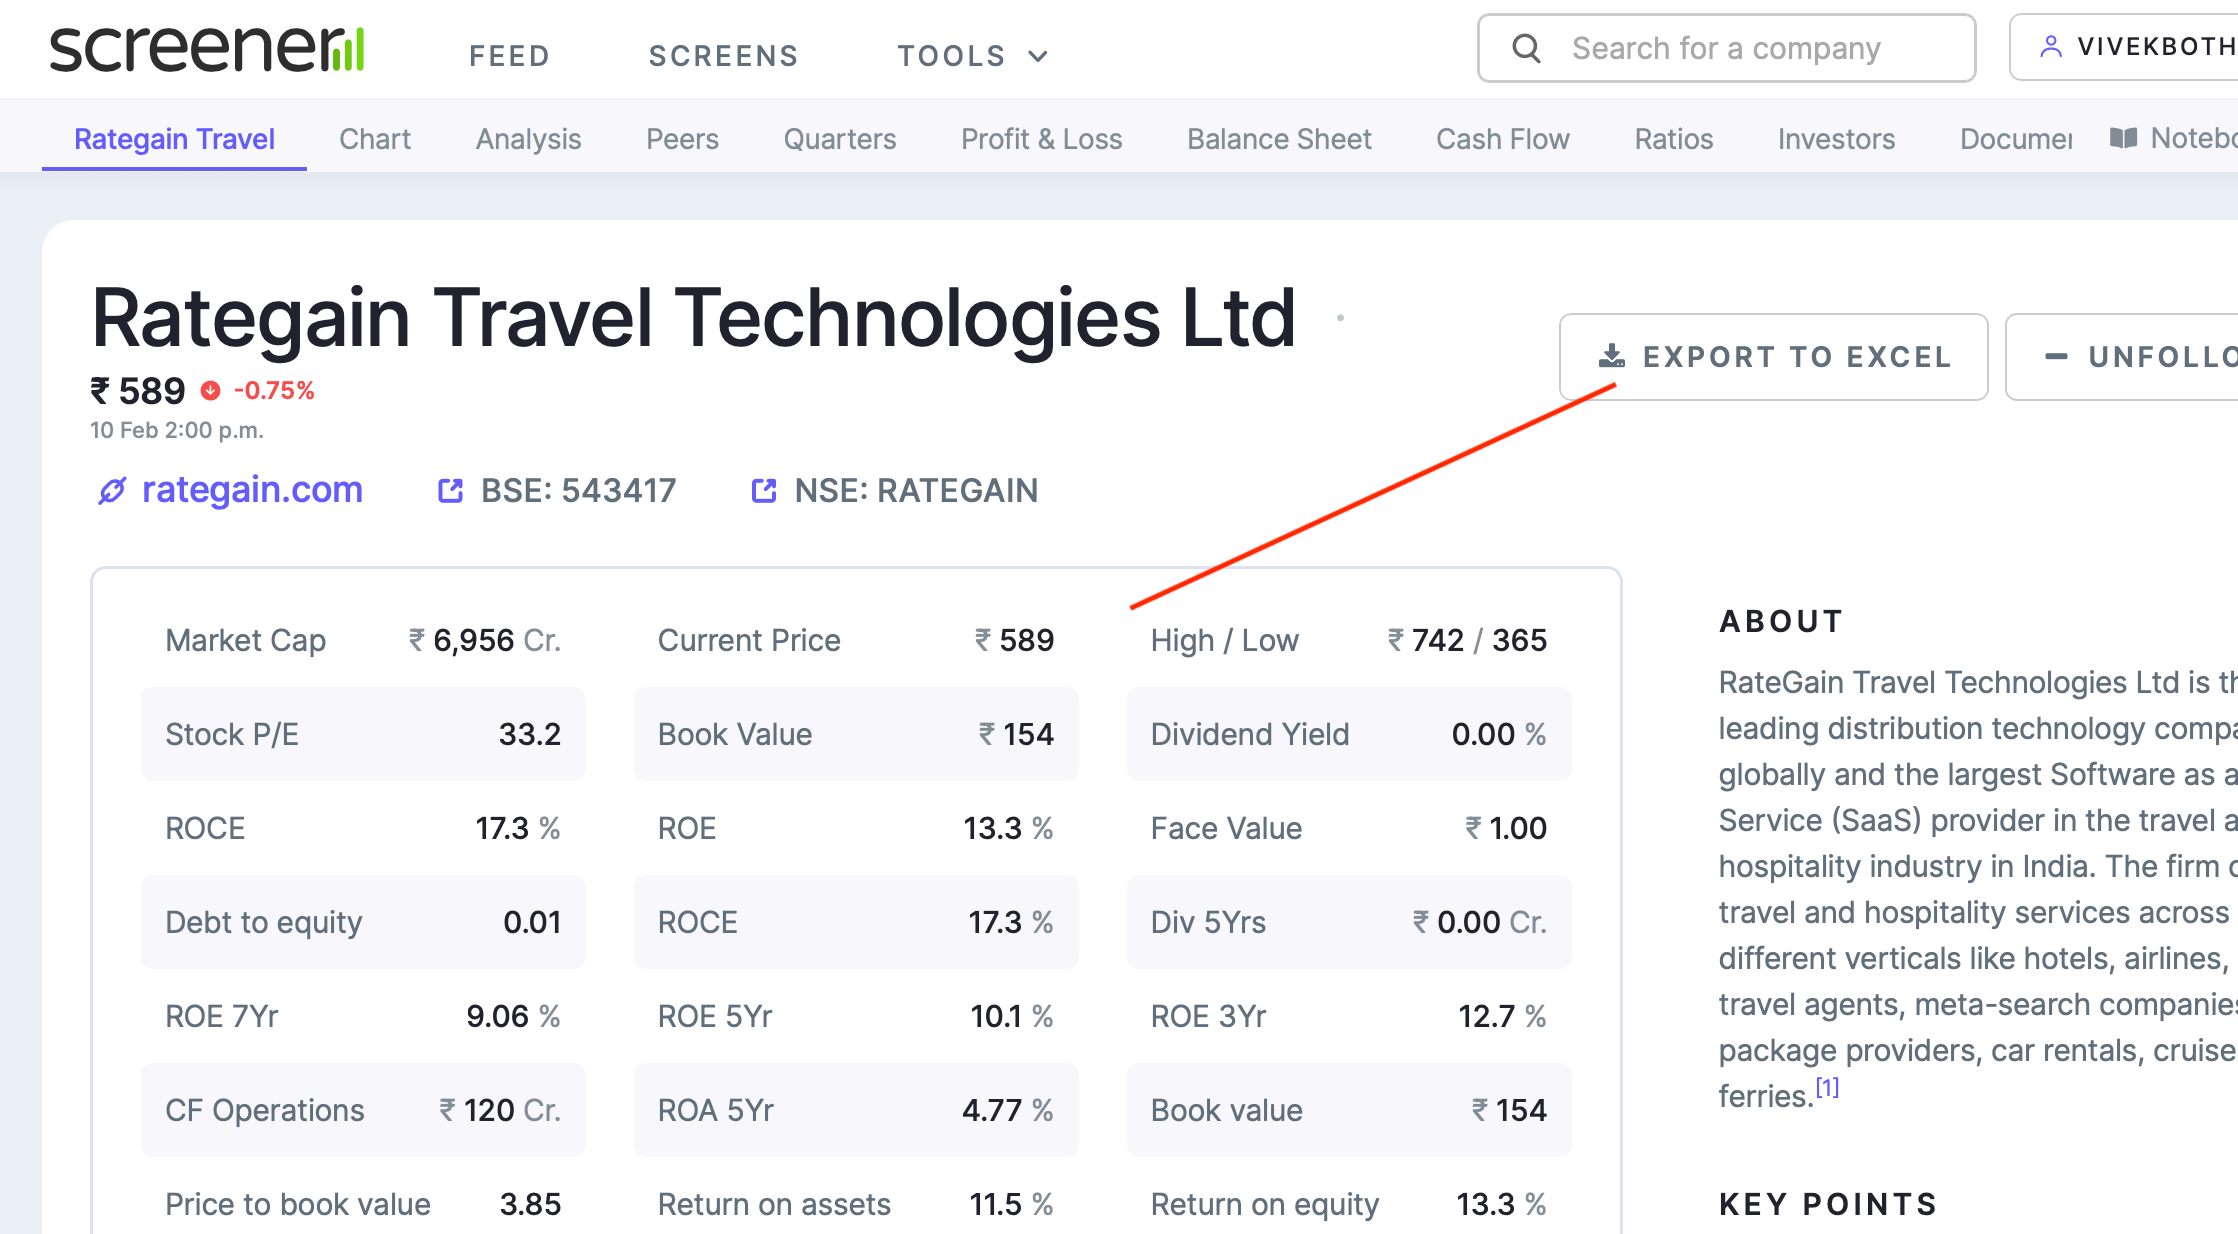
download file of company you want to analyse
Upload on free dashboard
and get instant, deep financial analysis with advanced investment frameworks.
Core Financial Analysis
Complete Financial Statements (P&L, Balance Sheet, Cash Flow)
Growth Metrics (CAGRs: 3yr, 5yr, 7yr, 10yr)
Profitability Ratios (ROE, ROCE, ROIC, Margins)
Efficiency Metrics (Asset Turnover, Working Capital, CCC)
Leverage Analysis (Debt-to-Equity, Interest Coverage)
Advanced Frameworks
Quality Score - 100-point comprehensive scoring system
Red Flags Detection - 7 balance sheet health checks
DuPont Analysis - ROE decomposition into components
Moat Analysis - Competitive advantage indicators
Capital Allocation - Management quality grading
Value Migration - Business trajectory analysis
Earning Power Box - 2x2 growth vs cash matrix
CAP Analysis - Competitive advantage period estimation
Capex Split - Maintenance vs growth capital allocation
Incremental ROIC - Returns on new capital deployed
RM Sensitivity - Raw material cost vulnerability
Buffett’s $1 Test - Capital allocation effectiveness
FLOAT Detection - Business model with customer funds
Visualizations
Revenue & Profit trends
Margin evolution
Returns analysis (ROE/ROCE)
Cash flow breakdown
Quarterly performance trends
CAP analysis chart
Additional Features to be built
Quarterly Analysis - QoQ and YoY growth trends
Comparison Mode - Compare 2-3 companies side-by-side
Print Support - Print-optimized layouts
Export - Save analysis as PDF
How to Use
1. Export Data from Screener.in
Go to screener.in
Search for any company
Click on “Export” button
Download the Excel file
2. Upload to Dashboard
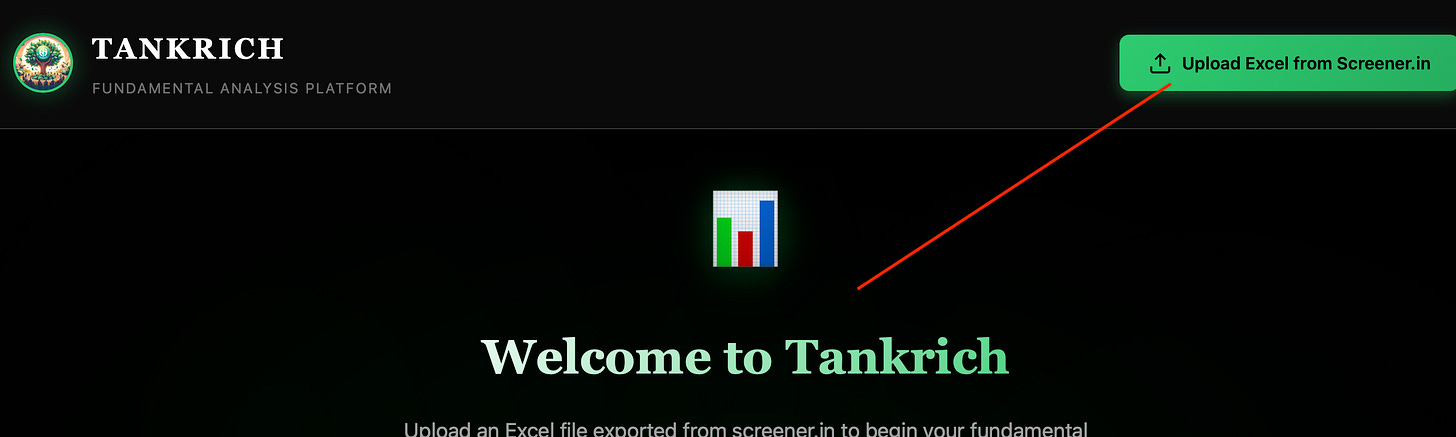
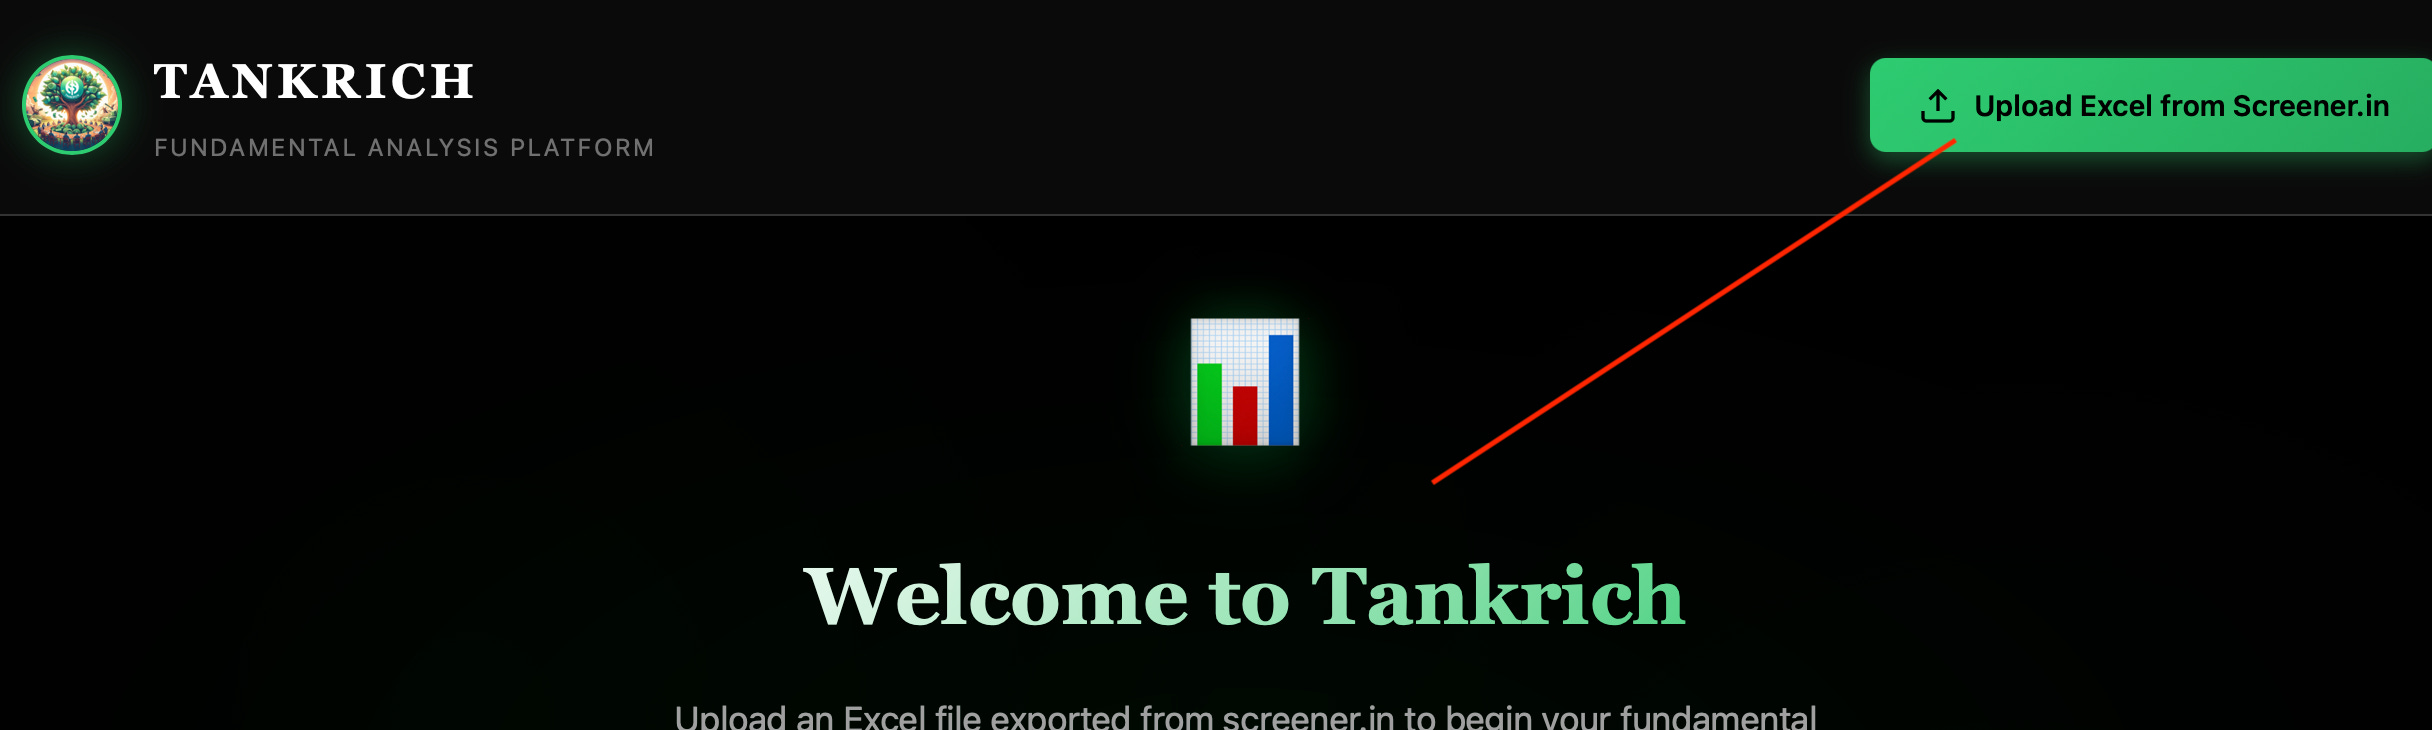
Open the Tankrich Dashboard
Click “Upload Excel from Screener.in”
Select your downloaded file
Analysis appears instantly!
What Each Section Tells You
Overview Tab
Quality Score: 100-point rating across 5 dimensions (profitability, returns, cash flow, balance sheet, growth)
Red Flags: Automatic detection of balance sheet issues
Growth Metrics: Historical CAGRs for revenue and profit
Returns: Latest year profitability ratios
How to Use New Features
Quarterly Analysis:
Navigate to “Quarterly” tab
View recent quarters’ performance
Check QoQ and YoY growth trends
Comparison Mode:
Load your first company
Click “Add for Comparison” button
Upload 1-2 more companies’ Excel files
Navigate to “Compare” tab to see side-by-side metrics
Use “Clear All” to reset
Print/Export:
Click “Print” to get print-optimized view
Use browser’s “Save as PDF” option
Export button available for future PDF generation
Statements Tab
Complete financial statements with 10 years of historical data
Quarterly Tab
Performance Trends: Quarterly revenue and profit visualization
QoQ Growth: Quarter-over-quarter growth rates
YoY Growth: Year-over-year comparisons
Latest 8-10 quarters of detailed data
Analysis Tab
DuPont Analysis: Understand what drives ROE (margins, efficiency, or leverage)
Efficiency Metrics: How well the company uses its assets
Leverage: Debt levels and coverage ratios
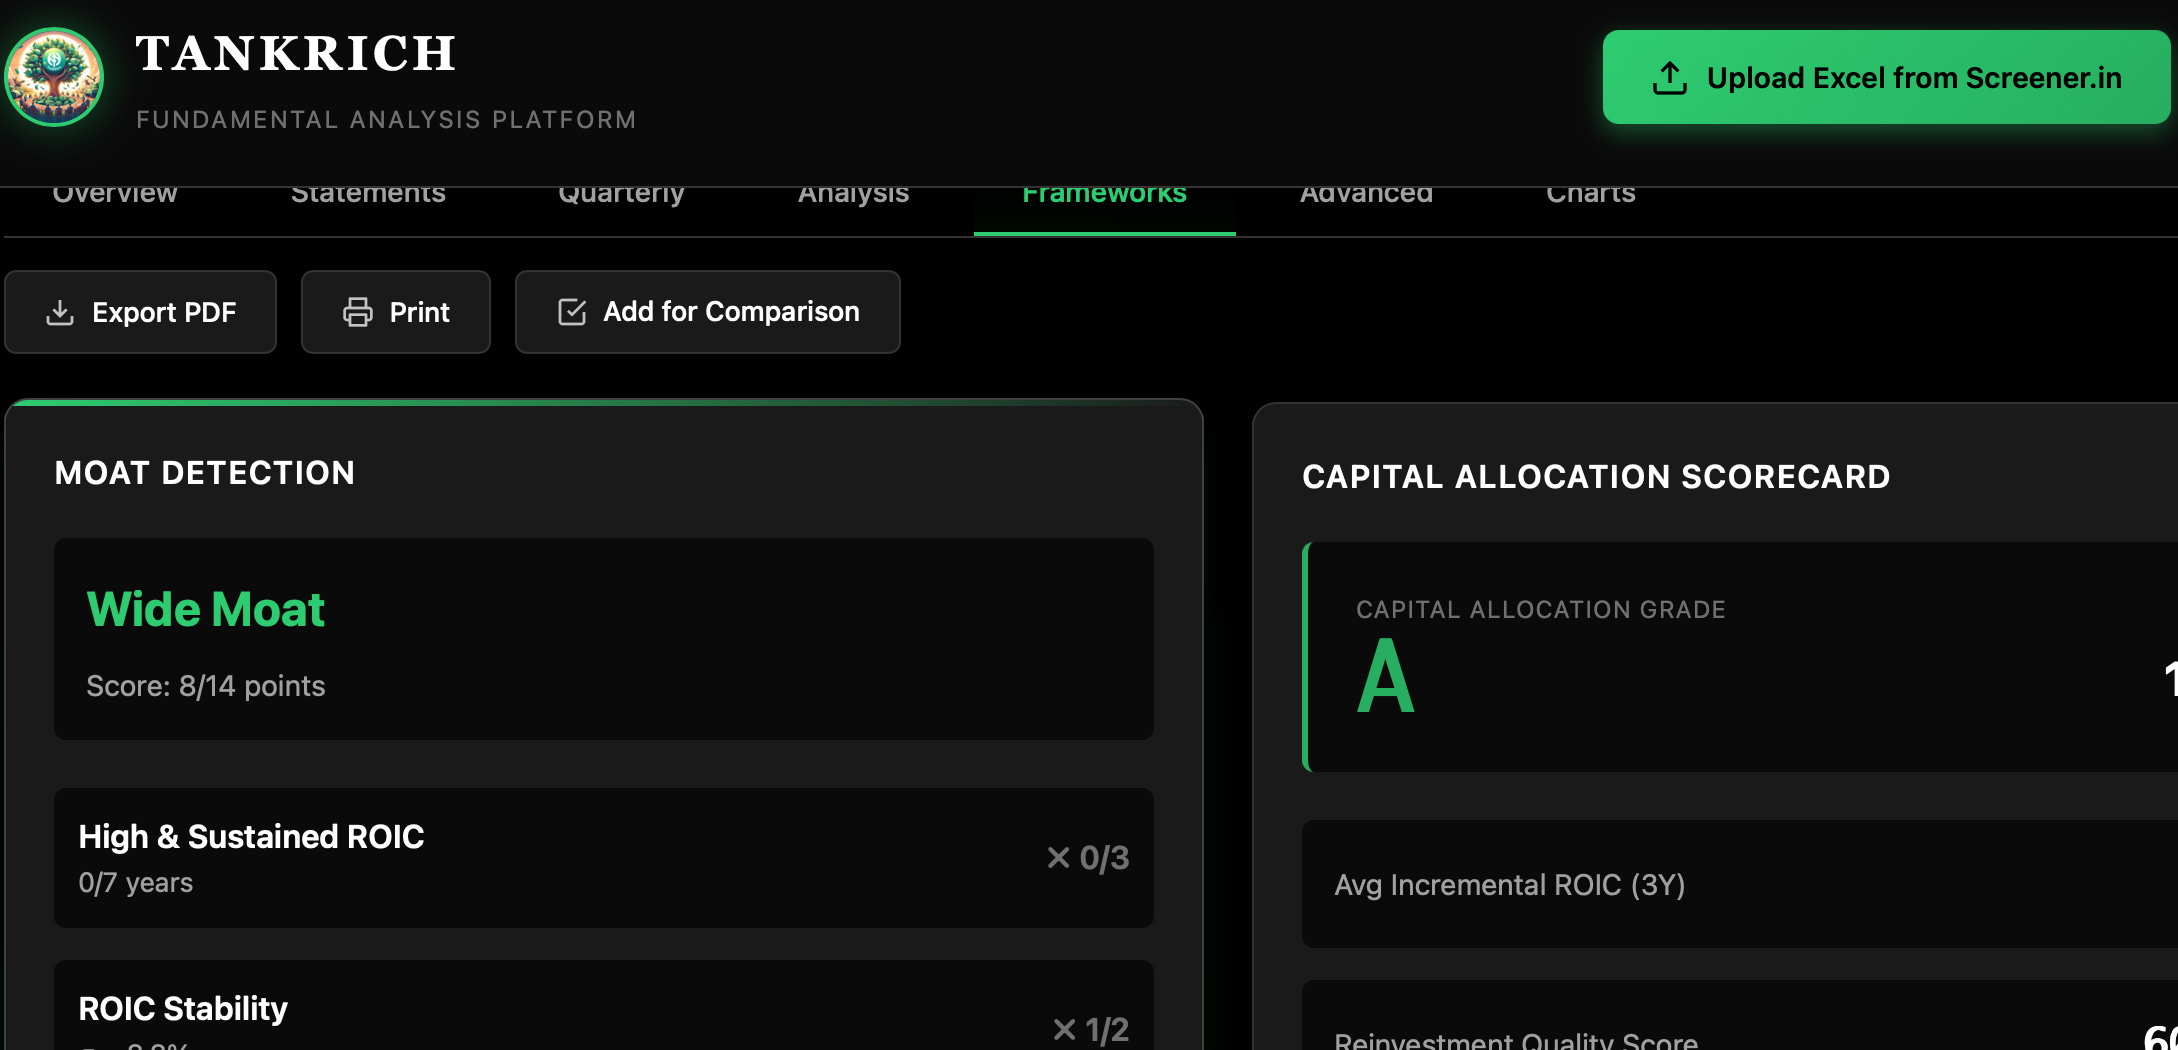
Frameworks Tab
Moat Detection: Does the company have sustainable competitive advantages?
Capital Allocation: How well does management deploy capital?
Value Migration: Is value flowing to or from this business?
Earning Power Box: 2x2 matrix positioning (growth vs cash generation)
Advanced Tab
CAP Analysis: Competitive advantage period - how long can high returns last?
Capex Split: Maintenance vs growth capex estimation
Incremental ROIC: Are new investments creating value?
RM Sensitivity: Vulnerability to raw material price changes
Buffett’s $1 Test: Is management creating value with retained earnings?
FLOAT Detection: Does the business benefit from customer funds?
Compare Tab (appears after adding companies)
Side-by-side comparison of key metrics across multiple companies
Charts Tab
Interactive visualizations of all key metrics over time
Technical Details
100% Client-Side: No data is sent to any server
Privacy First: All processing happens in your browser
No Installation: Works directly

My mission is to help mom and pop investors, to help me consider upgrading to paid
This is very useful. Thank you for sharing, Vivek. Wanted to know how it works? Like the factors behind the WACC or the capital allocation grading.