How to avoid Major Drawdowns?
There are many methods to identify if markets are overheated (Sellers Market) or under heated (Buyers Market), We can use
Historical PE vs Current PE
Historical book Value vs Current Book Value
Number of Stock making highs
Breadth of market (Number of up vs downs)
Overall Volume across markets and many more
In this post I want to delve on a simple Moving Average Cross Over Indicator.
The crux is below
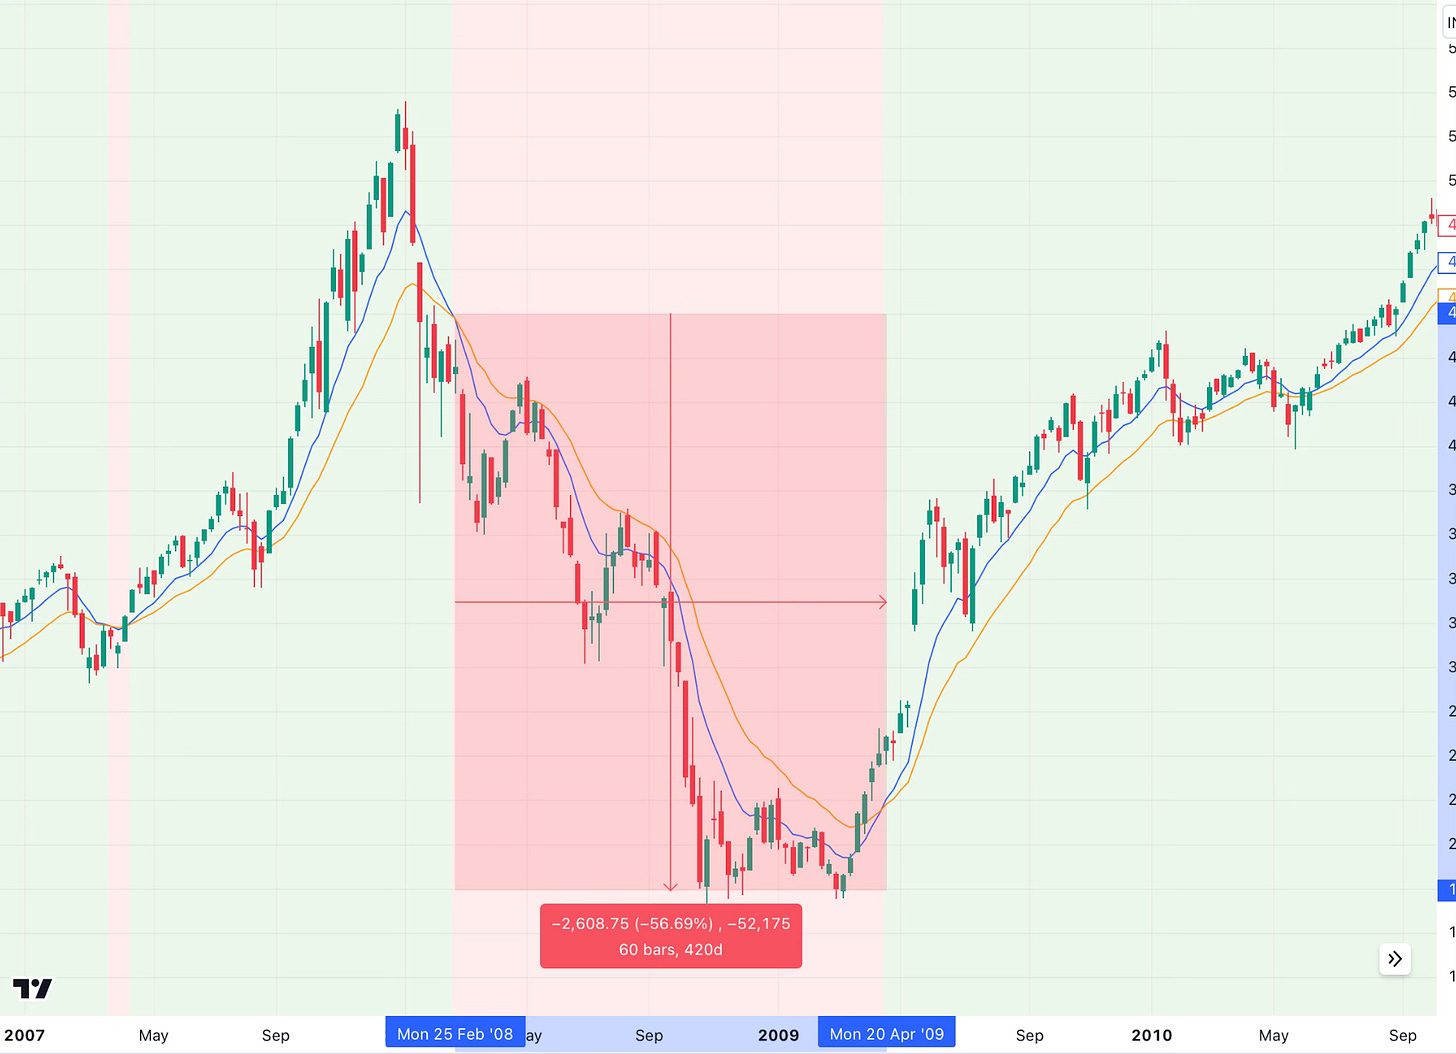
You monitor 10 week and 20 week EMA, if the 10 week EMA > 20 Week EMA then you are long otherwise you are out of market or short
I used this indicator for NSE 500 (India) , S&P 500 (USA) and ASX 200 (Australia) the results were pretty consistent as you can see below, the indicator moved you in cash on multiple key crash points in past
The Green background in chart indicates, that you were long or ‘in’ market , the red background indicates you are short or out of market
I also looked deeper how this would have fared in large crashes, I evaluated
Dot com bust
Global Financial Crisis
Covid Crisis
Russia Ukraine War
Lets look at NSE 500 for each of the above crashes
Dot com bust - Approx. 560 days out of market saving 50% of your money
GFC - Approx 420 days out saving more than 50% of your money
Covid Crisis
As the fall was very sharp, it would have only protected 13% of money for approx 125 days out of market
Russia - Ukraine war
Approx - 125 days, saving 10% of the money
if you want to add this indicator in your armour below is Trading view pine script code
//@version=5
indicator("10 EMA vs 20 EMA Background", overlay=true)
// Calculate the EMAs
ema10 = ta.ema(close, 10)
ema20 = ta.ema(close, 20)
// Change background color based on EMA conditions
bgcolor(ema10 > ema20 ? color.new(color.green, 90) : color.new(color.red, 90), title="Trade Window")
// Plot the EMAs on the chart
plot(ema10, color=color.blue, title="10 EMA")
plot(ema20, color=color.orange, title="20 EMA")
Join me on WhatsApp to get a gem daily, no noise click here
Ending post with something from Gallery


