
MTAR Technologies
NSE: MTARTECH · Precision Engineering → Defense · Space · Nuclear · Clean Energy
A Precision Engineering Fortress at the Intersection of India’s Four Greatest Secular Themes
Preface: Why This Business Earns the Right to Be Studied
Charlie Munger once said that all he wants to know is where he is going to die so he never goes there. Applying that inversion to equity investing: I want to know what kinds of businesses destroy wealth, so I can look for the opposite. Businesses that destroy wealth are typically commoditised, face powerful buyers and suppliers, operate in shrinking markets, have undisciplined management, and burn more cash than they generate. MTAR Technologies is, in almost every meaningful dimension, the opposite of that archetype.
MTAR makes precision-engineered components parts that hold tolerances of five to ten microns for four customers who cannot easily switch to anyone else: the Department of Atomic Energy (nuclear power), ISRO (space and launch vehicles), the Ministry of Defence (missiles and fighter aircraft), and Bloom Energy (solid oxide fuel cells for AI data centres). Each of these relationships is decades old. Each is protected by a qualification process that takes seven to ten years and cannot be shortcut. Each segment is, independently, in the early innings of a long structural growth story.
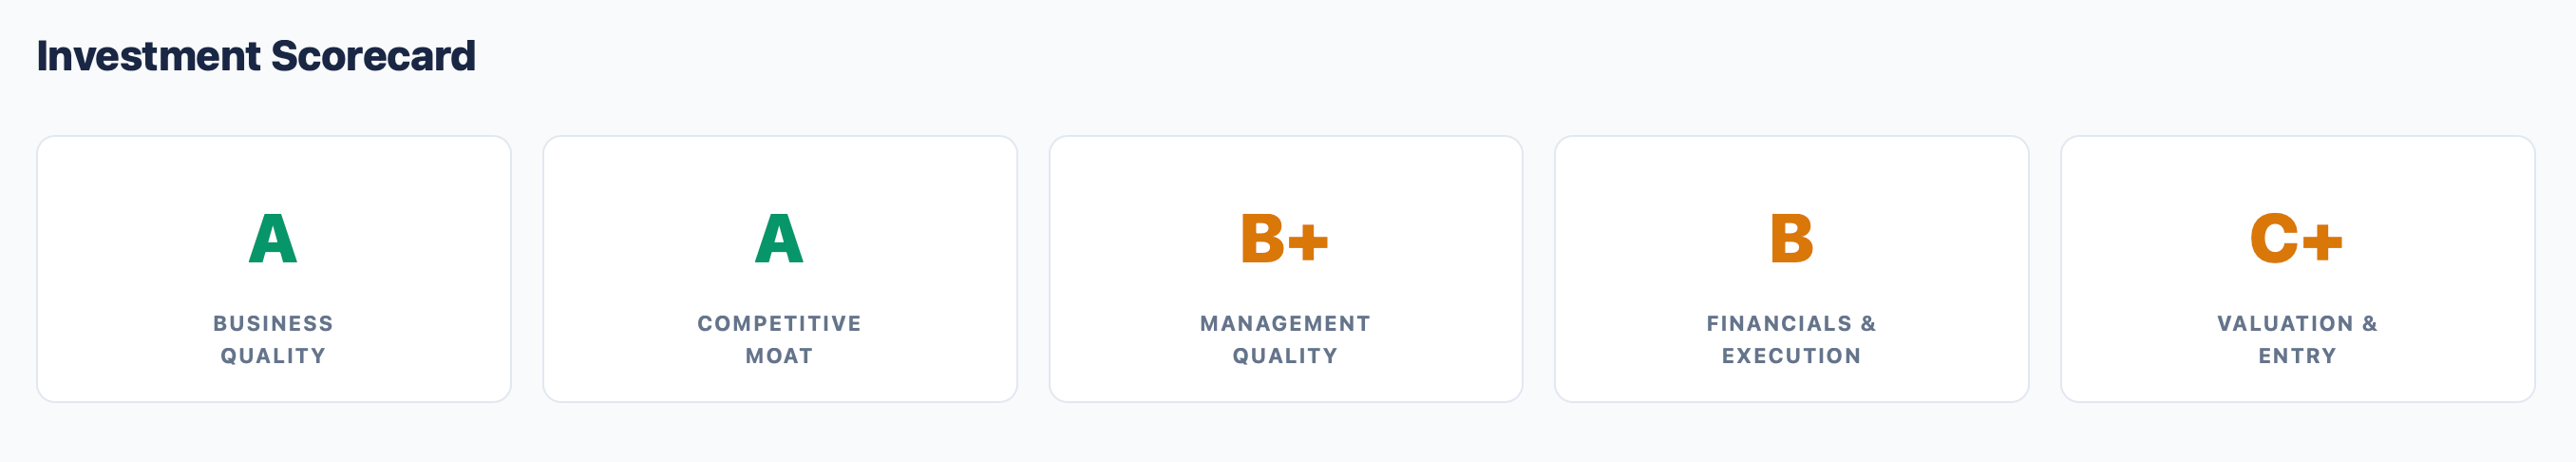
This post is my attempt to rigorously apply an integrated analytical framework business quality, competitive advantage, management integrity, financial health, and valuation to arrive at an honest assessment of what MTAR is worth and whether the current price offers a margin of safety. I will try, in the tradition of good research, to argue both sides of the trade honestly before arriving at a conclusion.
Personal Research. Not Investment Advice. I have may or may not have position in the stock and I am not going to provide to any regular update on this company , use this post as starting point and not as a stock tip.
Part I: The Business — What Does MTAR Actually Do?
1.1 The Irreplaceable Component Maker
MTAR Technologies, headquartered in Hyderabad and founded in 1970 by P. Ravindra Reddy, is a precision engineering company that manufactures components and sub-assemblies for mission-critical applications. The key word is “mission-critical.” When the Vikas engine powers a PSLV rocket off the launchpad, or when a nuclear reactor at Kaiga runs its drive mechanisms, or when a Bloom Energy fuel cell quietly generates power for an Amazon data centre somewhere in that chain is a component made by MTAR.
The company’s business can be described simply: take a block of exotic alloy (Inconel, titanium, nuclear-grade steel), and machine it to tolerances that most manufacturing facilities in the world cannot achieve. Then deliver it on time, with the precise documentation trail that nuclear regulators, ISRO quality assurance, and US defence contracts demand. That is the whole business. Simple to describe. Extraordinarily difficult to replicate.
1.2 The Four Business Segments
MTAR’s revenues come from four distinct segments, each with its own demand driver, customer relationship, and growth trajectory:
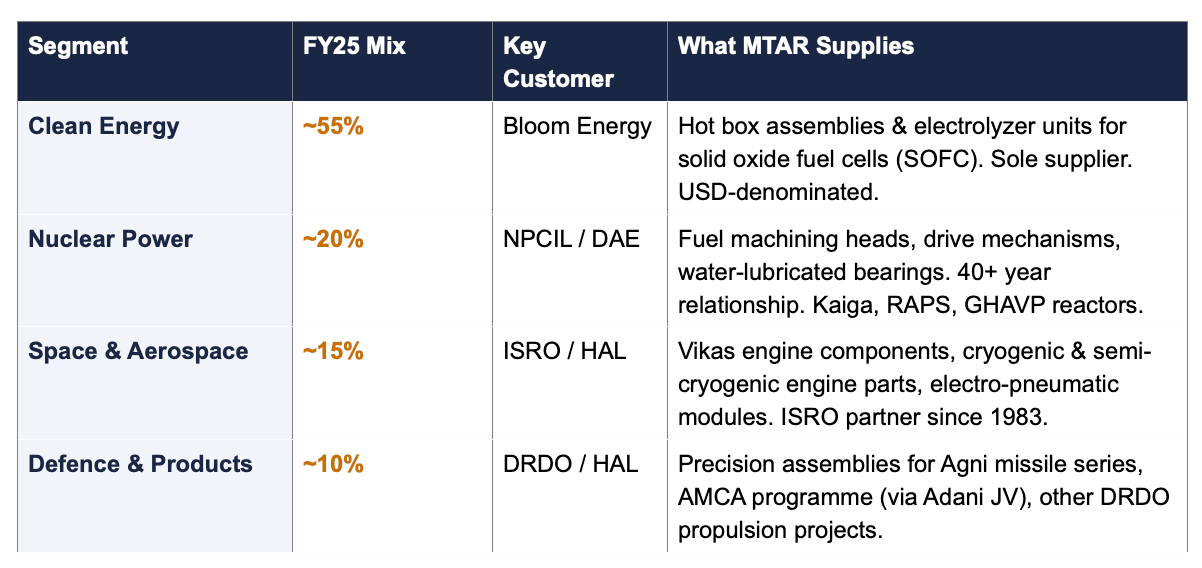
A critical observation: each of these four segments has an independent demand driver. If India’s nuclear programme slows, Bloom Energy’s data centre orders might be accelerating. If ISRO delays a launch, the defence ministry might be awarding more missile contracts. This multi-segment structure provides meaningful earnings resilience that a single-customer precision manufacturer would not have even as the Bloom Energy concentration (55% of FY25 revenue) remains the single most important risk to monitor.
Part II: The Industry — Four Secular Growth Vectors
2.1 Clean Energy: The AI Data Centre Tailwind
Bloom Energy makes solid oxide fuel cells (SOFCs) devices that convert natural gas into electricity at approximately 60% efficiency without combustion, generating very little noise, zero water usage, and dramatically lower emissions than diesel generators. For AI data centres, which require 24/7 uninterrupted power at densities that the conventional grid struggles to supply, SOFCs are increasingly the answer.
In FY2025, Bloom Energy reported record revenues of $2.02 billion, up 37.3% year-on-year. For FY2026, management has guided revenues of $3.1–3.3 billion —> implying 54–63% growth. The company’s product backlog has surged to approximately $20 billion. The AI data centre boom is the primary driver.
“The thing about Bloom’s backlog is that it represents real, contracted, signed orders not a pipeline or a TAM estimate. At $20 billion against annual revenues of $2 billion, that is ten years of forward revenue. MTAR, as Bloom’s sole indian supplier of hot box assemblies, is the direct beneficiary.”
MTAR’s current hot box capacity is 8,000 units per year. The company is investing to expand this to 12,000 units (FY26), 20,000 units (FY27), and 30,000 units (FY28). This phased expansion demand-driven, backed by signed supply commitments is the most visible near-term earnings catalyst for MTAR. In September 2025, MTAR secured a $43.9 million supply deal with Bloom Energy for hot boxes and electrolyzer units, confirming the trajectory.
2.2 Nuclear Power: India’s Renaissance
India currently has approximately 8,200 MW of nuclear power capacity across 24 reactors. The government has approved 13 new reactors including ten 700 MW Pressurised Heavy Water Reactors (PHWRs) targeting 21,880 MW by 2032. Three units are under construction (RAPS-8, GHAVP-1, GHAVP-2). The ASHVINI joint venture between NPCIL and NTPC adds four more 700 MW units at Mahi Banswara. By 2047, India targets 100 GW of nuclear capacity.
For a precision component manufacturer with MTAR’s nuclear qualifications, this is multi-decade locked-in revenue. Nuclear reactor construction requires thousands of precision-machined components, each with specific material certifications, dimensional tolerances, and quality documentation trails that take years to establish. MTAR’s Q3 FY26 nuclear order inflows of ₹500 crore in a single quarter signal the acceleration of this opportunity.
The moat in nuclear is perhaps the deepest of all four segments. India’s nuclear regulatory framework (the Atomic Energy Act, 1962, and the Atomic Energy Regulatory Board) requires that every supplier to a nuclear facility maintain an approved quality assurance manual, complete material traceability, and a physical inspection and test record for every component. Getting “qualified” as a nuclear component supplier takes seven to ten years. Once qualified, there is effectively no price competition NPCIL cannot simply switch to a cheaper supplier without repeating the entire qualification process.
2.3 Defence: India’s Atmanirbhar Imperative
India’s defence budget for FY2026–27 stands at ₹7.85 trillion a fifteen percent increase year-on-year and an all-time high. More importantly for MTAR, seventy-five percent of the total acquisition budget is now earmarked for domestic procurement, up from fifty-eight percent in FY20-21. The government’s stated target is to double military production to ₹3 trillion by 2029.
MTAR’s defence relationships are deep and long-standing. The company supplies precision assemblies for the Agni missile programme, has partnered with Adani Defence for the Advanced Medium Combat Aircraft (AMCA) prototype, and holds AS9100D and CEMILAC certifications that are prerequisites for defence supply. Defence capex is projected to grow at 12.3% CAGR through 2030 faster than overall defence spending (7.8% CAGR) as India accelerates indigenous military hardware production.
2.4 Space: The Gaganyaan Era
India’s space policy, revised in 2023, opened the sector to private participation for the first time. The Indian space economy currently approximately $9 billion is projected to reach $44 billion by 2033, implying a 26% CAGR. MTAR has been ISRO’s trusted supplier of propulsion system components since 1983, a relationship spanning the company’s entire modern history.
Gaganyaan, India’s crewed spaceflight programme, is in final stages. The first uncrewed test mission (with the Vyommitra half-humanoid robot) is scheduled for early 2026; the crewed mission has been moved to Q1 2027. ISRO’s semi-cryogenic engine, which will boost LVM3’s payload capacity by 24% while reducing costs by 25%, is scheduled for its first flight in 2027. MTAR is the manufacturer of choice for both programmes. Each new launch vehicle variant, each new mission, requires a new set of precision engine components and MTAR is the supplier.
A note to reader, most insitutional grade research like this will be behind a paywall, I try to keep 50% of my Sunday newsletter free so that everyone can benefit from reading these deep dives consider upgrading and supporting an independent voice
Part III: The Moat — Why Can’t a Competitor Do This?
3.1 Porter’s Five Forces: An Unusually Favourable Structure
I find it useful to run a business through Porter’s Five Forces before reaching any conclusion about competitive advantage. For MTAR, the exercise produces a striking result.
Entry barriers are extraordinarily high. To supply nuclear reactor components, a new entrant must spend seven to ten years obtaining nuclear quality assurance certifications, building the institutional knowledge to maintain them, and convincing a government regulator who is accountable for the safety of millions of people to approve them as a supplier. No private equity investor would fund a start-up to displace MTAR in the NPCIL supply chain. The economic incentive does not exist, because NPCIL would not approve the switch.
Buyer power is near zero in three of four segments. NPCIL cannot switch suppliers without a multi-year re-qualification. ISRO cannot rebuild a 43-year supplier relationship overnight. Bloom Energy has invested capital in MTAR’s capacity expansion they are financially committed to the relationship. Only in defence, where HAL and DRDO have some alternatives, does buyer power exist at a moderate level.
Supplier power is moderate but manageable. MTAR uses specialty alloys (Inconel, titanium, nuclear-grade steel) from a limited number of approved global suppliers. However, the company’s vertical integration in-house heat treatment, coating, assembly, and inspection reduces its dependency on any single input supplier. The machines themselves (DMG Mori, Makino CNC centres) are capital items, not recurring inputs.
Competitive rivalry is effectively zero within MTAR’s specific niches. There is no Indian competitor qualified to supply NPCIL’s fuel machining heads. There is no alternative supplier of hot boxes for Bloom Energy from India. The company is not competing in a market; it is operating in a series of captive niches where it is the only qualified incumbent.
Substitute products present negligible risk. A nuclear reactor’s drive mechanism cannot be substituted. An ISRO Vikas engine’s turbopump casing has no alternative design. The precision of the end application mandates the precision of the component.
3.2 Sources of Competitive Advantage
Scouring the literature on competitive advantage Porter, Buffett, Munger, Pat Dorsey I find MTAR has not one but four overlapping sources of moat, which is the hallmark of a truly durable franchise:
1. Regulatory and certification moat
Nuclear N-stamp equivalent (NPCIL QAM), ISRO AS9100D, DRDO/CEMILAC approvals, and Bloom Energy’s proprietary supplier qualification. These are not certificates that can be bought or rushed. They are earned through years of zero-defect delivery, detailed documentation, and site audits. Replication by a new entrant is possible in theory and near-impossible in practice.
2. Customer lock-in moat
The switching cost for MTAR’s customers is asymmetric. For NPCIL, switching costs are effectively infinite the regulatory re-qualification process would take longer than the component’s own service life. For Bloom Energy, switching costs include the capital it has co-invested in MTAR’s capacity expansion. Switching costs create pricing power, and pricing power is the core of long-term value creation.
3. Process know-how moat
Five-to-ten micron tolerances at production scale is not a specification that can be achieved by purchasing new CNC machines. It requires accumulated process knowledge: the right coolants, tool paths, fixturing methods, inspection protocols, and crucially, a workforce that has internalized these methods over years. MTAR’s Hyderabad facility has engineers who have been machining these components for two and three decades.
4. Institutional relationship moat
MTAR’s relationship with ISRO predates the company’s own stock market listing by three decades. The institutional memory the tacit knowledge of what ISRO needs, how it reviews drawings, what its quality assurance culture demands lives inside MTAR. Bloom Energy’s engineers have worked alongside MTAR’s manufacturing team to co-develop the hot box production process. These relationships are not assets on the balance sheet, but they are the most valuable thing the company owns.
“A truly great business must have an enduring moat that protects excellent returns on invested capital. The dynamics of capitalism guarantee that competitors will repeatedly assault any business castle that is earning high returns.” — Warren Buffett, 2007 Annual Letter
The question for MTAR is not whether the moat exists it clearly does but whether it is wide enough to sustain returns on capital above the cost of capital over a long period. The answer is yes, with the important caveat that current reported returns are temporarily depressed by the profit compression of FY24–25. I will address this in detail in next part
Part IV: The Management — The Stewards of the Fortress
4.1 Capital Allocation: The Ultimate Test
Munger says the most important quality in a CEO is rational capital allocation. Let us apply that test to MTAR.
The company has, over the past three years, invested approximately ₹300 crore in expanding its hot box manufacturing capacity and nuclear component production lines. This capex is demand-led: signed supply contracts from Bloom Energy and confirmed NPCIL orders preceded the capacity expansion. It is the unglamorous, patient work of building capacity ahead of confirmed demand.
The IPO proceeds in FY21 (₹600 crore raised) were used for debt repayment and working capital, consistent with the stated use of proceeds. There have been no acquisitions at dubious valuations, no related-party transactions of concern, and no issuance of warrants to promoters at below-market prices.
Where capital allocation has been imperfect is in working capital management. Inventory days swelled from 82 in FY19 to a peak of 246 in FY23, and remained elevated at 186 in FY25. Management attributed this to pre-stocking for anticipated large orders from Bloom Energy and NPCIL orders that were then deferred, creating a cash conversion headache. The vindication of this explanation came in Q3 FY26, when record revenues of ₹278 crore the quarter in which the pre-stocked inventory was finally shipped resulted in OCF of approximately ₹102 crore for the full FY25 (1.89 times net profit).
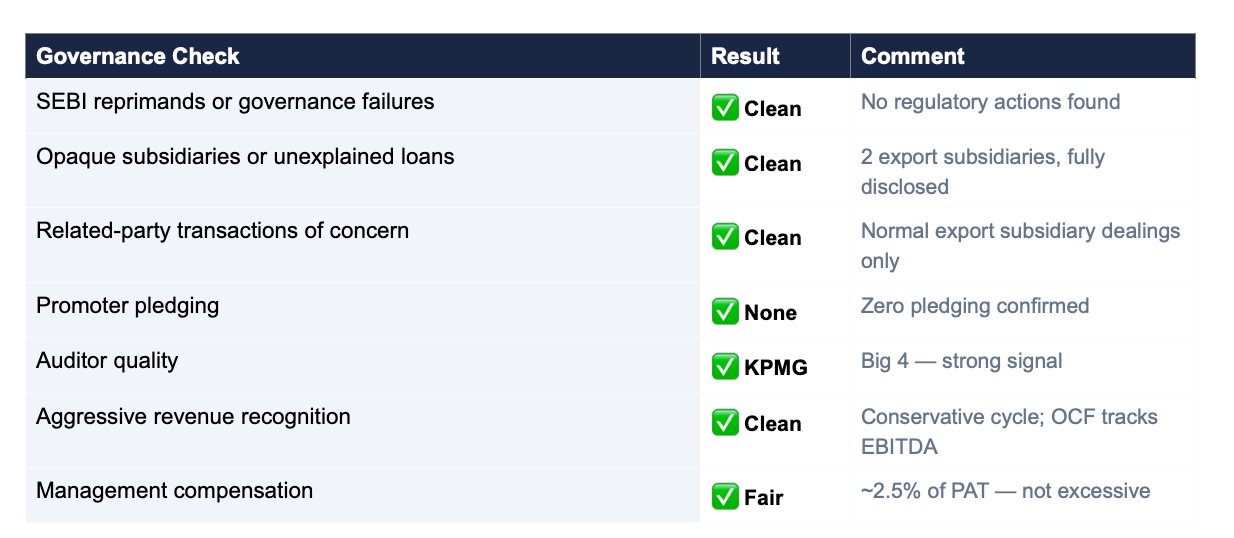
4.2 The Fraud Screen: Applying the Checklist
I run every management through a standard fraud and governance checklist. For MTAR, the results are largely reassuring:
4.3 The Promoter Selling Question: The One Genuine Concern
Promoter holding in MTAR fell from 36.4% to 31.4% in a single quarter September to December 2024. This is the single most important governance concern I have with the company. Let me think through it carefully.
There are two interpretations. The pessimistic interpretation: the founders have concluded that the stock is overvalued at these prices and are reducing their stake while they can. This would be consistent with the behaviour of insiders who know something the market does not.
The optimistic interpretation: second-generation promoters are diversifying personal wealth a rational and common behaviour in Indian family-run companies, especially post-IPO when shares become liquid for the first time. The timing (high stock price) is rational personal finance, not necessarily a statement about the business.
My honest assessment: I cannot determine which interpretation is correct from the available information. What I can say is that total promoter holding of 31.4% is meaningfully lower than the 46%+ post-IPO level, and the pace of reduction is faster than I would like. I watch this metric quarterly. A fall below 28% would cause me to revisit the thesis with renewed scepticism.
4.4 Second Generation: The Succession Question
The current MD, Parvat Srinivas Reddy, is the second generation. The institutional relationships with ISRO, NPCIL, DRDO, and Bloom Energy were established by his father, P. Ravindra Reddy, over fifty-plus years. How much of the relationship is personal versus institutional?
The answer, I believe, is mostly institutional. ISRO’s procurement process does not depend on knowing the founder personally; it depends on supplier qualifications, drawing approvals, and quality records. NPCIL’s nuclear quality assurance programme is a bureaucratic institutional process, not a personal one. Bloom Energy’s manufacturing partnership is governed by supply contracts, not personal relationships. The risk of relationship loss due to succession is real but, in my assessment, manageable.
Part V: The Financials
5.1 The Business Model Ratios: Applying the Framework
The most important financial question for any business is: does it earn returns above its cost of capital? For MTAR, the answer requires careful interpretation. The company’s “normal” earnings are not represented by FY24 or FY25 both of which were distorted by order deferrals, interest cost from growth capex, and elevated inventory. The “normal” earnings are better represented by FY23 (₹104 crore PAT) or the FY27 recovery scenario.
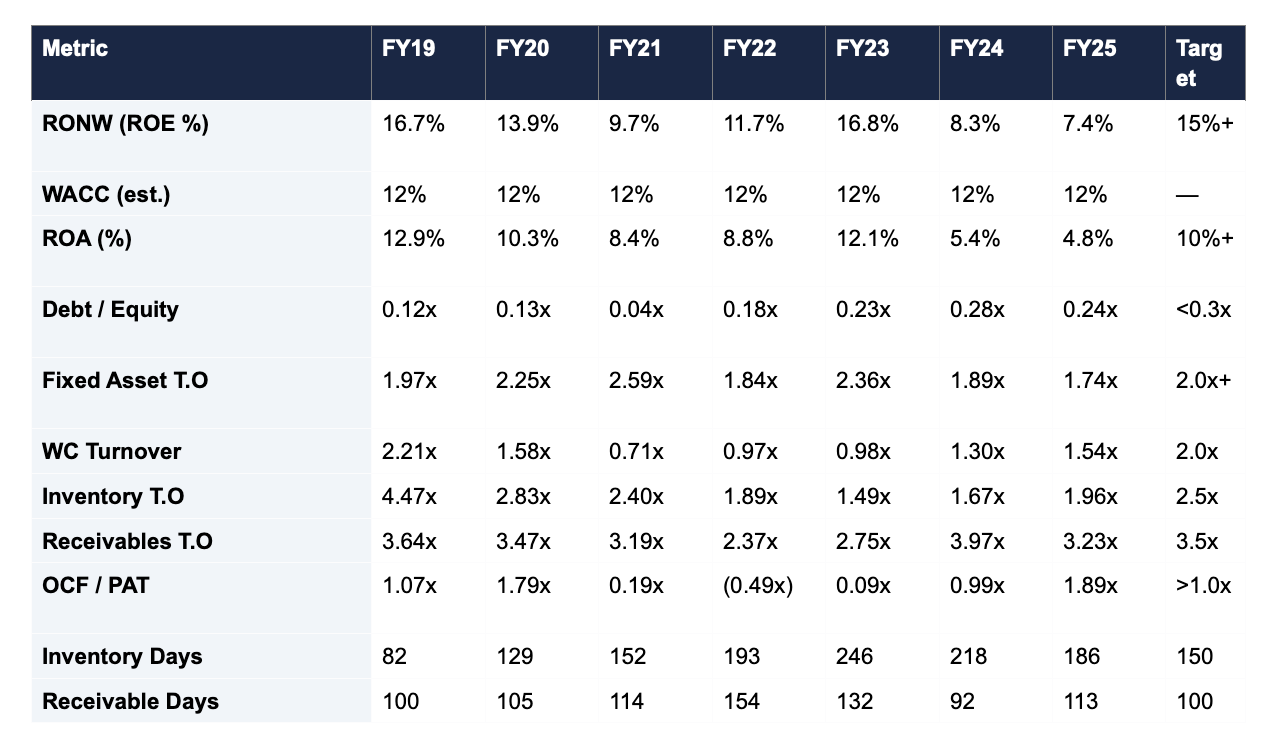
Two observations from this table demand our attention.
First, the RONW-versus-WACC comparison. In FY25, MTAR’s return on equity of 7.4% is below its estimated WACC of 12%. This means the company, at current reported earnings, is not creating economic value it is consuming it. This is a critical finding that a bullish investor cannot ignore. The counter-argument is that current earnings are cyclically depressed by three factors: (a) elevated depreciation from the FY22–24 capex cycle, (b) interest costs on the debt taken on to fund that capex, and (c) the one-time working capital impact of pre-stocking for orders that were deferred. At normalised FY27 earnings which I will estimate in Part VII RONW recovers to approximately 15–17%, consistent with the FY19 and FY23 peaks.
Second, the OCF-to-PAT ratio. After years of sub-optimal cash conversion (FY21–24), FY25 delivered OCF of ₹101.8 crore against PAT of ₹53.9 crore a ratio of 1.89 times. This is powerful evidence that the underlying business generates real cash. The high depreciation (non-cash charge of ₹31.8 crore in FY25) is the primary driver of this divergence. A business that generates ₹102 crore of operating cash on ₹676 crore of revenue is a healthy business, even if the reported profit line looks compressed.
5.2 Revenue: Quality and Consistency
MTAR’s revenue has compounded at 26.5% per annum over ten years, it reflects genuine secular demand from all four end-markets, the company’s successful qualification for new programmes (Bloom Energy’s hot box, nuclear PHWR series), and its expanding share of ISRO’s propulsion component budget.
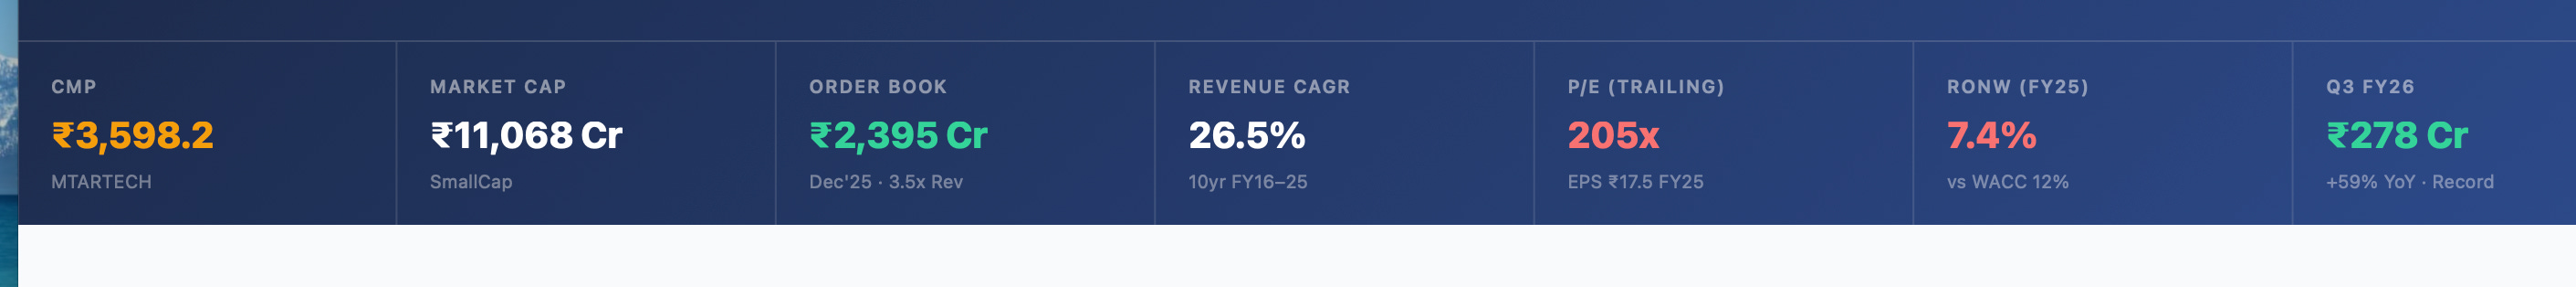
FY24 was the one stumble revenue growth of just 1.2%. I have analysed this carefully. It was order deferral: Bloom Energy pushed shipments from early FY24 into late FY24 and FY25, partly due to their own inventory management and partly due to data centre project timing. NPCIL similarly pushed some nuclear component orders due to construction scheduling. Neither deferral was a structural deterioration of the business relationship. The proof is in Q3 FY26: record quarterly revenue of ₹278 crore, fresh orders of ₹1,369 crore in a single quarter, and an order book of ₹2,395 crore representing 3.5 times annual revenue.
5.3 Accounting Quality: A Clean Bill of Health
I have run MTAR through a detailed accounting quality screen and found no meaningful red flags. Revenue recognition is conservative: orders are confirmed, manufactured, inspected, delivered, and then recognised. There are no aggressive policy changes, no unusual reserves, no repeated restructuring charges. The auditor is KPMG’s BSR & Co. a Big 4 firm with appropriate independence and credibility. Tax rates at approximately 26% are consistent with statutory rates. There are no FCCB liabilities, no material derivative exposure, and no off-balance-sheet obligations of concern.
The one accounting observation worth noting is the inventory build. Inventory as a percentage of revenues has risen from 22% in FY19 to 51% in FY23 and stands at 51% in FY25. Management’s explanation that this represents pre-stocking for anticipated large orders has been validated by Q3 FY26’s record delivery. But working capital efficiency remains a key metric to track: the target of reducing inventory days from 186 to 140–160 by FY27 will be the financial test of management execution.
Part VI: The Risks — Invert, Always Invert
6.1 The Inversion Discipline
“Invert, always invert. Turn a situation or problem upside down. Look at it backwards. What happens if all our plans go wrong? Where don’t we want to go, and how do you get there?” — Charlie Munger
Rather than asking what must go right for this investment to work, let us ask what must go wrong for it to fail. If we can identify the failure conditions clearly, we can then assess their probability and decide whether the current price adequately compensates us for those risks.
6.2 Risk 1: The Bloom Energy Concentration
Bloom Energy accounts for approximately 55% of MTAR’s FY25 revenue. This is the most important risk in the thesis. If Bloom Energy’s demand slows whether because the AI data centre capex cycle moderates, because Bloom loses ground to battery storage or nuclear microreactors, or because Bloom faces financial distress MTAR’s revenue and earnings would be materially impacted.
The mitigating factors: Bloom’s $20 billion backlog and $3.1–3.3 billion FY2026 revenue guidance provide 6–8 years of near-term visibility. MTAR’s supply contract is denominated in USD, providing a natural hedge against INR strength. And MTAR is actively diversifying nuclear now represents 31% of the order book versus 20% of recent revenues, and defence is growing through the AMCA programme.
My assessment: a 30–40% decline in Bloom Energy orders over a 12-month period would reduce MTAR’s FY27 revenue by approximately ₹300–400 crore and push PAT below ₹60 crore. At that PAT level, and at the current market capitalisation, the stock would be deeply unattractive. This is the bear case in Part VII.
6.3 Risk 2: Valuation Demands Execution
At a trailing P/E of 205 times, MTAR is not a stock you own passively. It is a stock that demands quarterly monitoring. At current depressed earnings of ₹54 crore PAT, the entire market capitalisation of ₹11,068 crore implies a payback period of over 200 years on current earnings. This is only sensible if you believe as I do that FY25 earnings are cyclically depressed and will recover sharply.
Any disappointment in the recovery trajectory whether FY26 revenue falls short of the implied 40–50% growth, or margins fail to recover toward 21–23%, or the order book shrinks rather than grows would cause a violent de-rating. The premium valuation is the sword of Damocles hanging over every MTAR position.
6.4 Risk 3: Working Capital and Liquidity
With net debt of ₹161 crore and cash of only ₹16.6 crore, MTAR does not have a large liquidity buffer. If order deferrals were to recur as they did in FY24 the company would face both a revenue shortfall and continued working capital stress. In an extreme scenario, a second year of ₹55–60 crore PAT with continued inventory build would push the balance sheet toward a point where equity dilution becomes a risk.
This risk is mitigated by the strong OCF generation in FY25 (₹102 crore) and the signed nature of the order book ₹2,395 crore of confirmed orders provides meaningful revenue visibility. But liquidity is not abundant, and I factor this into position sizing.
6.5 Risk 4: Promoter Governance
I have discussed this above. The significant promoter stake reduction in one quarter is the most immediate governance concern.
A continuation of this trend specifically a fall below 28% holding would cause me to reassess whether the founders are signalling something about the future that is not yet visible in the order book or earnings.
6.6 Risk 5: Government Programme Delays
Every MTAR revenue segment is ultimately dependent on government programme execution. Gaganyaan has been delayed twice. NPCIL nuclear projects have historically faced construction schedule slippage. DRDO programmes run on bureaucratic timelines that can shift. This structural feature of MTAR’s business means that quarterly earnings will always be lumpy and partially unpredictable. Investors who need smooth, predictable quarterly earnings should look elsewhere.
Part VII: The Valuation — What Are We Paying and What Do We Get?
7.1 The Scenario Framework
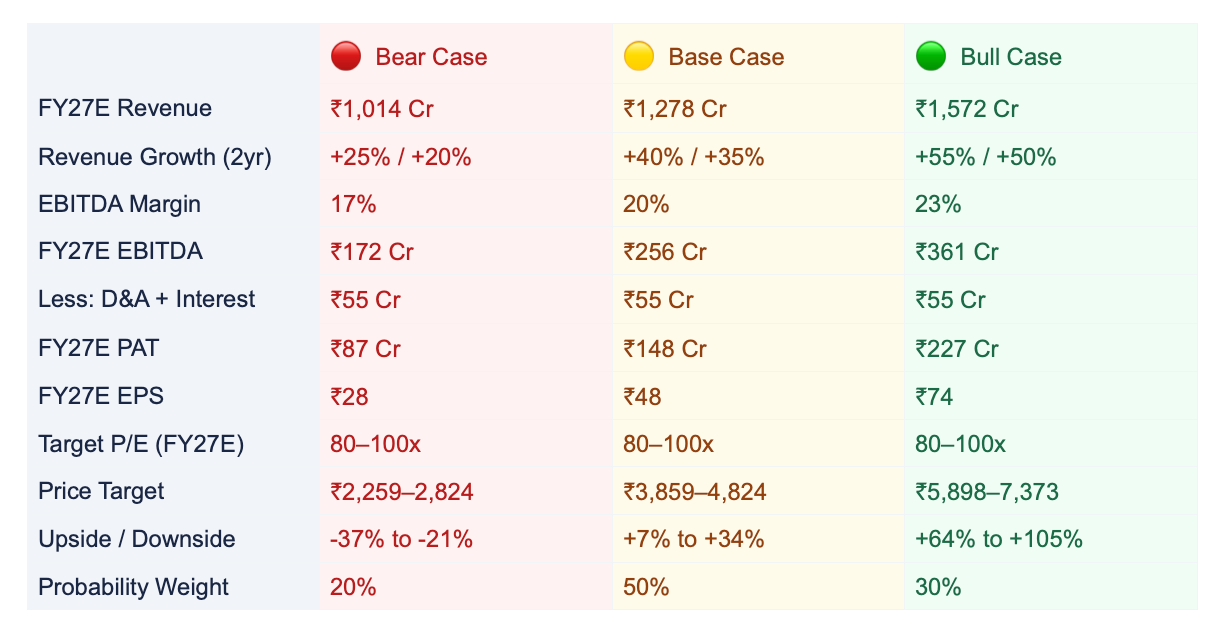
I use a three-scenario approach pessimistic, base, and optimistic to bracket the range of reasonable outcomes. The key inputs are FY27 revenue (two years forward from FY25’s ₹676 crore base) and EBITDA margin. I then estimate PAT after subtracting estimated D&A and interest of approximately ₹55 crore and applying a 26% effective tax rate.
Learn all our systems here
The probability-weighted expected price, using these scenarios, is approximately ₹4,100–4,300 — implying 14–19% upside from the current market price of ₹3,598. This is a modest but positive expected return, with the key swing factor being whether Bloom Energy’s FY26 revenue guidance ($3.1–3.3 billion) materialises as expected.
Why 80–100x was used
MTAR is priced as a quality compounder in a structurally scarce category precision engineering for mission-critical, defence-adjacent applications with deep regulatory moats. The Indian market has historically rewarded this category of company with premium multiples. Comparable companies like Mtar’s closest peers (MTAR itself listed at ~85x FY22 earnings), and broader “capital goods with moat” names like Kaynes Technology, Divi’s Laboratories at peak, or Data Patterns have all commanded 60–120x PE during growth phases. The argument for a high multiple rests on:
Earnings visibility from a ₹2,395 Cr order book (3.5x annual revenue)
Decade-long customer lock-in that makes earnings more bond-like than typical manufacturing
Low float + high institutional demand for quality precision engineering names
The Bloom Energy growth trajectory is essentially contracted, not projected
7.2 The Munger Big-No-Brainer Test
Munger advocates identifying the “big no-brainer” elements of any investment thesis — the irreducible facts that determine the outcome. For MTAR, these are:
Even in the bear case (₹1,014 crore revenue, 17% EBITDA margin), PAT of ₹87 crore puts the stock at 127 times FY27E earnings at current prices. This is not cheap on any traditional metric.
In the base case (₹1,278 crore revenue, 20% margins), FY27E PAT of ₹148 crore puts the stock at 75 times forward earnings — expensive, but potentially defensible for a business with structural moats in four of India’s fastest-growing sectors.
The bull case (₹1,572 crore revenue, 23% margins) requires flawless execution on Bloom’s record backlog, nuclear Kaiga order conversion, and defence AMCA ramp-up — simultaneously. Possible, not certain.
The downside is asymmetrically worse than a typical quality stock because the current P/E of 205 times leaves no room for any negative surprise. A single quarter of missed expectations would cause a sharp derating.
The math, therefore, favours owning MTAR but not at any price.
7.3 What the Stock Price Already Assumes
A useful discipline before buying any stock is to reverse-engineer what the current price assumes. At ₹3,598 and 3.076 crore shares outstanding, the market capitalisation is ₹11,068 crore. To justify this at a long-run P/E of 60 times (which itself assumes structural competitive advantage), the market is assuming steady-state earnings power of approximately ₹185 crore PAT.
Is ₹185 crore PAT achievable? Yes — it requires approximately ₹1,200–1,300 crore of revenue at 21–22% EBITDA margins. This is the base case FY27E scenario. In other words, the current stock price is essentially already pricing in the base case FY27 outcome. There is limited upside unless the bull case materialises, and meaningful downside if the bear case unfolds.
Part VIII: Conclusion — The Thesis in Full
8.1 What This Business Is
MTAR Technologies is a precision engineering company with irreplaceable positions in four of India’s most structurally attractive growth sectors. It is a fast grower — revenue CAGR of 26.5% over ten years — in a temporary profit dip caused by order timing, not business deterioration. Its competitive advantages — nuclear certifications, ISRO approvals, sole-supplier lock-in with Bloom Energy are the most durable kind: regulatory and relationship-based moats that take a decade to replicate and cannot be purchased.
8.2 What the Numbers Say
The business earns above its cost of capital in normalised years. FY23 ROE of 16.8%, ROA of 12.1%, and EBITDA margins of 26.9% are the benchmark for what this business can achieve. FY24–25 represent a temporary compression, not a structural reset. Q3 FY26’s record revenue and expanding margins confirm the recovery thesis. The order book of ₹2,395 crore provides 3.5 times revenue coverage the highest in the company’s history.
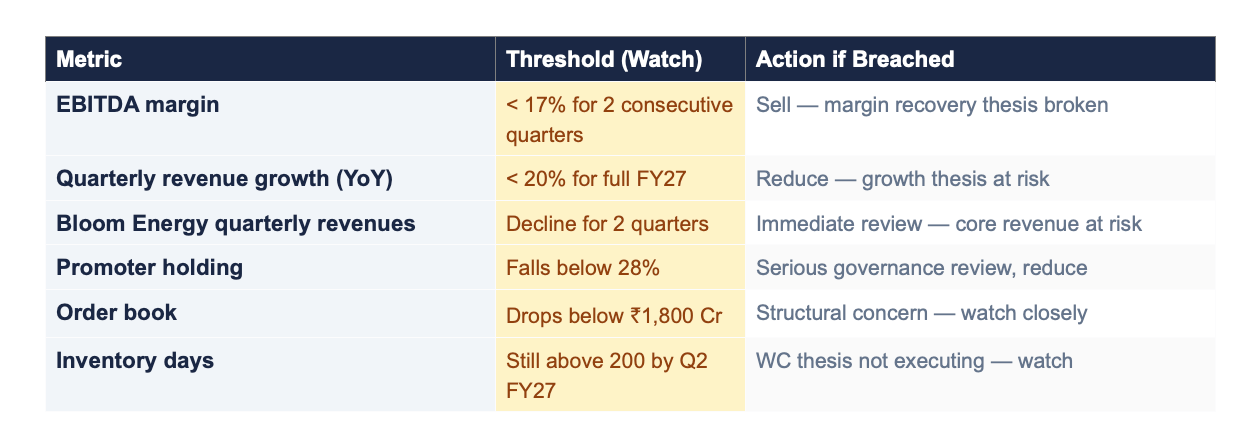
8.3 The Key Monitoring Framework
This is not a stock to own passively. The following metrics must be tracked every quarter:
8.4 The Final Verdict
MTAR Technologies is a high-quality franchise in a temporary earnings dip, operating in four of the most structurally attractive sectors in India’s economy. The competitive advantages are genuine, durable, and difficult to replicate. The management is largely clean with one important governance concern (promoter selling) that requires ongoing monitoring. The accounting is conservative and the OCF generation is strong.
The principal risk is valuation: at 205 times trailing earnings, the stock price has already priced in a substantial recovery. The base case FY27 scenario ₹1,278 crore revenue, 20% EBITDA margin, ₹148 crore PAT implies a forward P/E of approximately 75 times, which leaves limited room for valuation expansion. The margin of safety is thin at the current price.
To use the language of risk-reward: the upside is modest from here, the downside is manageable for a patient investor, and the long-term compounding story if MTAR executes over five to seven years across all four segments is genuinely compelling. The stock belongs in a portfolio of high-quality Indian businesses. The position size should reflect the valuation premium and the Bloom concentration risk.
“The stock market is a device for transferring money from the impatient to the patient.” — Warren Buffett
— End of Thesis —