
The Study That Was Right About Everything — Except the Part Nobody Read
A nine-year audit of India's most important investment framework, and what it means for your portfolio in 2026
It is December 2016. India is fifty days into demonetisation. ATM queues are longer than IPO application lines ever were. The Nifty has just shed 1,200 points in two months. Investors are confused, nervous, and mostly paralysed.
In the middle of this noise, Raamdeo Agrawal quietly releases the 21st Annual Wealth Creation Study themed “Focused Investing: Power of Allocation in Wealth Creation.”
Most people read the top 10 lists and moved on. A few read the Kelly formula section and found it interesting. Almost nobody internalised the framework deeply enough to act on it.
Nine years later, the companies in that study have gone in wildly different directions.
One became the decade’s biggest fraud. One collapsed from a single newspaper headline. One became a multi-trillion-rupee compounding machine. And some of the companies the study labelled wealth destroyers came back as the best performers of the subsequent five years.
The framework predicted all of it.
This post is my attempt to reconstruct what the 21st Study actually said, audit it honestly against what happened, and then apply its logic to where we are today.
Part 1: The Problem Nobody Talks About
Before getting to the framework, understand why it was even necessary.
In equity investing, virtually all discussion centres on what to buy which sector, which company, which theme. The 21st Study opened with a disarmingly simple observation: the previous 20 annual studies had all been about what to buy. Not one had seriously addressed how much to buy.
This is a massive blind spot.
To illustrate, the study presented a hypothetical portfolio of 10 stocks with varying individual returns: one stock returned +50%, another +40%, down to one that returned -40%. Now, if you invested equally across all 10, your portfolio returned 5%.
But here’s the punchline: the same 10 stocks, simply by changing how much you allocated to each, delivered total portfolio returns ranging from -8.5% to +18.5%.
Same stocks. Same returns on each stock. Wildly different outcomes based purely on allocation.
It is what happens in real portfolios every single day. Most investors who got the stock selection right still underperformed because they sized the wrong bets too large and the right bets too small.
The 21st Study called this the most underresearched aspect of investing, and it set out to fix that.
Part 2: Kelly’s Formula, Decoded
To build their allocation framework, the study borrowed from an unlikely source: John Larry Kelly Jr, a scientist at Bell Labs who, in 1956, developed a mathematical formula for placing optimal bets in games of chance.
Kelly’s original formula: f = (bp – q) ÷ b
Where f is the fraction of your capital to wager, b is the odds (how much you win per rupee bet), p is the probability of winning, and q is the probability of losing.
The study adapted this for equity investing where the outcomes are not binary, losses are rarely total, and both probabilities and payoffs are estimated rather than known. The equity version becomes:
f = (Up – Dq) ÷ U
Where U is the potential upside, D is the potential downside, p is your estimated probability of the upside occurring, and qis your probability of the downside.
The mathematics become secondary. The three insights from Kelly are what matter practically:
Insight 1: Look for asymmetric payoff. The ideal investment situation is one where the upside is large and the downside is small. Not 2:1 odds. Genuinely asymmetric situations where a correct thesis gets you 5x and an incorrect thesis loses you 20–30%. These are not common. But when they appear, the formula says: act.
Insight 2: Create an edge. In Kelly’s framework, you only bet when you have an edge when you know something that tilts the odds in your favour. In equity markets, information advantages have been largely arbitraged away by technology. What remains is analytical advantage: understanding a business or sector more deeply than the consensus. This takes work, not tips.
Insight 3: When you have edge and asymmetry together bet big. This is the counterintuitive one. Most investors diversify by reflex, diluting their best ideas with their weakest ones. Kelly says that when you have genuine conviction supported by genuine analysis, concentration is not recklessness it is optimal. Please read word that again genuine is 2 hours of chat with chatgpt
The study encapsulated this in four words: Bet seldom. Bet big.
Part 3: What Is Focused Investing, Exactly?
The study positioned Focused Investing as the golden mean between two extremes.
Diversified investing (50+ stocks, index investing) is the dominant form of institutional investing. Its virtue is managing volatility. Its vice is that it guarantees average returns you are essentially buying the market’s average.
The US data is telling. A 2012 academic study (Yeung et al.) found that portfolios consisting of only the highest-conviction bets of fund managers their top 5 to 10 positions consistently outperformed the very funds from which those bets were extracted, and did so without significantly higher risk. The managers knew their best ideas. They just buried them in noise.
Concentrated investing (less than 10 stocks) is the style of investors like Warren Buffett, Charlie Munger, and Phil Fisher. Buffett’s alpha over the Dow during his partnership years (1957–1968) was 20.4% per year. Munger’s alpha over S&P 500 was 14.9%. The returns are extraordinary but the year-to-year volatility is psychologically brutal.
Focused Investing the study’s recommended approach is 15 to 20 stocks across sectors. Enough to diversify company-specific risk. Concentrated enough for meaningful allocation in high-conviction ideas. Risk research shows that company-specific risk is near-fully diversified at 15–20 stocks; adding more stocks beyond this point adds no diversification benefit.
In practice, this means: maintain a watchlist of 50–100 quality businesses, have serious conviction on 15–20, and size them based on relative confidence not uniformly.
Part 4: The Selection Filter — QGLP
For stock selection, the study formalised a framework that Raamdeo Agrawal had been practising for two decades: QGLP — Quality, Growth, Longevity, and Price.
Q — Quality of Business × Quality of Management. The study expressed this as a multiplication, not addition. If either is zero, Q is zero. A phenomenal business with fraudulent management? Q = 0. A brilliant manager running a commoditised, structurally declining business? Also Q = 0. Both conditions must be satisfied.
Quality of business is assessed through: competitive moat (monopoly/oligopoly positioning, brand strength, switching costs), large profit pool, pricing power, high and sustained Return on Equity, and strong operating cash flow.
Quality of management is assessed through: unquestionable integrity (governance, tax compliance, dividend policy), demonstrable competence (strategy and execution track record), and growth mindset (capital allocation, long-term orientation).
G — Growth in earnings. The study makes a subtle but crucial point: growth only creates value when a company earns returns above its cost of capital. A company growing revenues at 30% but deploying capital at 8% returns while its cost of capital is 12% is actually destroying value. Growth is an amplifier — it makes good businesses better and bad businesses worse.
L — Longevity of Q and G. This is where most investors underestimate. A business that is high-quality and high-growth today but loses its advantage in 3 years is worth far less than one that sustains both for 15 years. The study introduced the concept of Competitive Advantage Period (CAP) — the duration over which a company generates returns above its cost of capital. Extending CAP is the holy grail of quality investing.
P — Price. No quality framework is complete without a valuation discipline. The study is explicit: even the best company, bought at the wrong price, will disappoint. The simplest test is whether you are getting valuation growth as a tailwind (buying below intrinsic value) or a headwind (buying above).
The selection framework essentially says:
if a company scores high on Q, G, and L — and you can buy it at a P that represents reasonable value allocate meaningfully. If Q is questionable, no price makes it a good investment.
Part 5: The Allocation Tool — CAP (Confidence-Adjusted Payoff)
Having selected stocks using QGLP, the study proposes CAP — Confidence-Adjusted Payoff as the allocation tool.
CAP translates your analytical conviction into a portfolio weight. For each stock, you estimate:
The upside scenario and its probability (how big is the opportunity if the thesis plays out?)
The downside scenario and its probability (what happens if it doesn’t?)
The expected payoff: (upside × probability) – (downside × probability)
Stocks with high expected payoff and high Q-score get higher allocations. Stocks where you are less confident or where the asymmetry is thinner get smaller allocations. Stocks where you have conviction on Q but are still waiting for price to improve stay on the watch list they are not bought just to fill a slot in the portfolio.
The disciplined application of CAP is what separates the +18.5% portfolio from the -8.5% portfolio using the exact same 10 stocks.
Part 6: The Leaderboard — Who Made the List in 2016?
Now let us look at the actual companies that appeared in the 21st Study.
Top 10 Fastest Wealth Creators, 2011–2016:
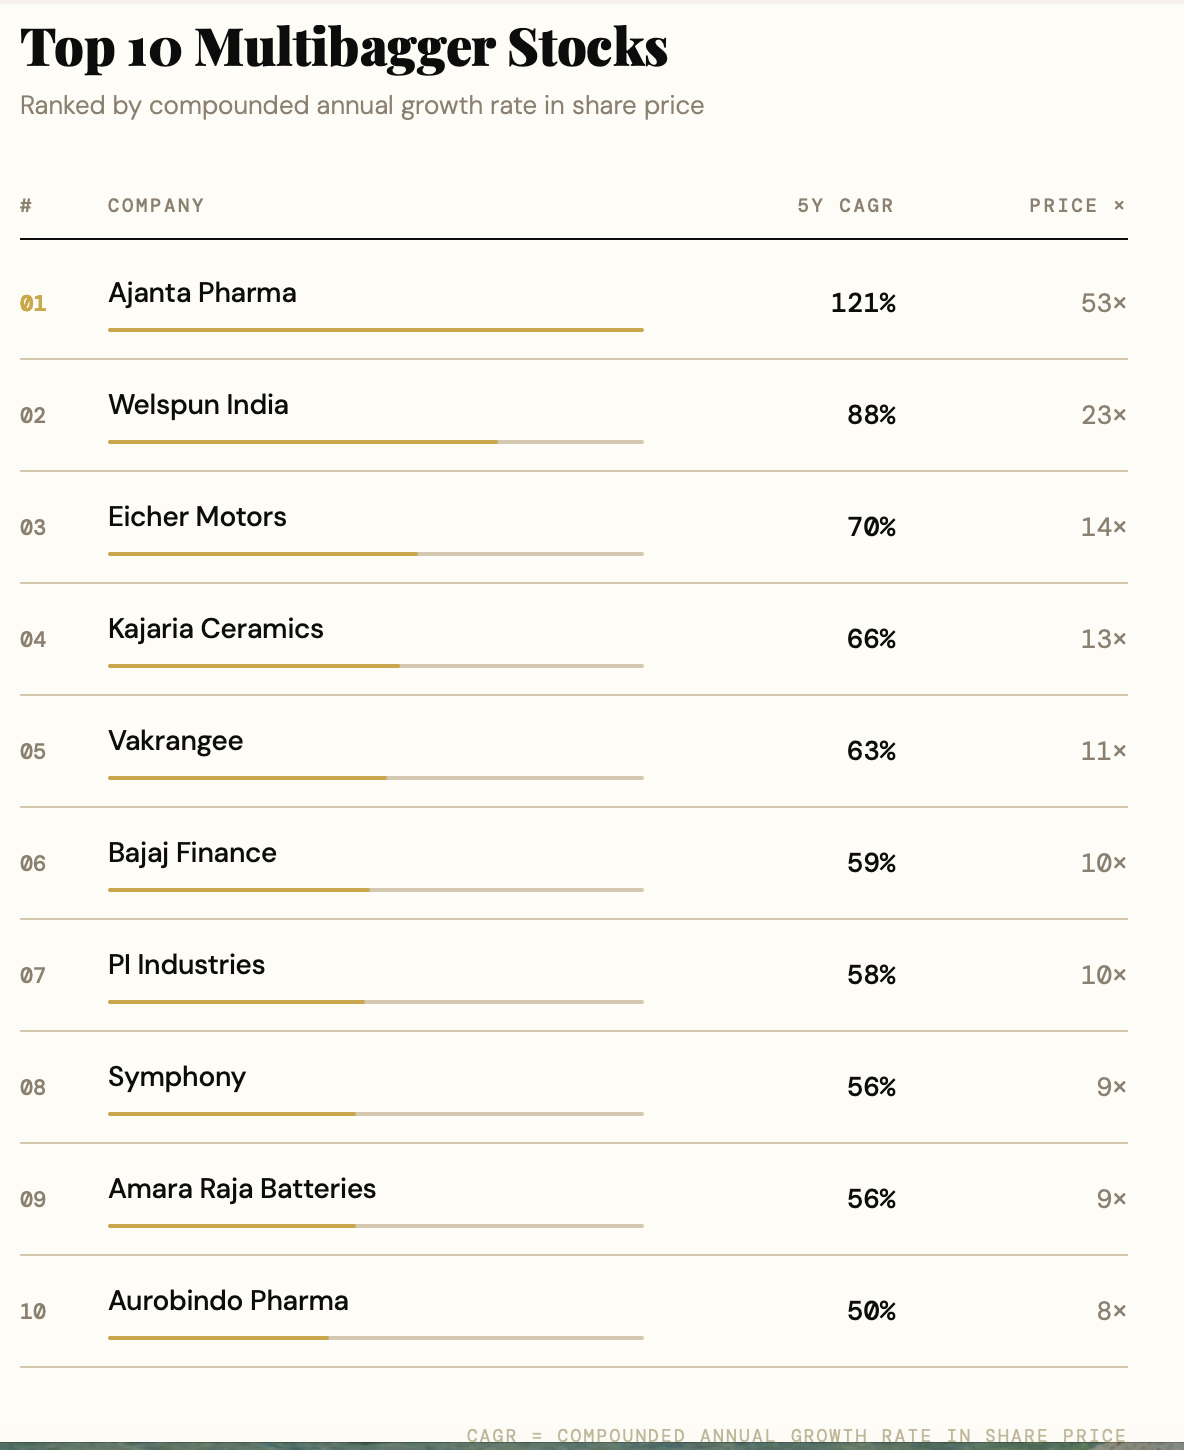
Top 10 Most Consistent Wealth Creators, 2006–2016 (10 consecutive appearances): Asian Paints, Kotak Mahindra Bank, Sun Pharma, Titan Company, Bosch, HDFC Bank, Axis Bank, Dabur India, Nestle India, Cummins India.
Top 10 Wealth Destroyers, 2011–2016: MMTC, NMDC, BHEL, ONGC, Jindal Steel, Vedanta, SBI, NTPC, SAIL, Coal India — seven of the ten were global commodity businesses.
Part 7: Nine Years Later — The Audit Nobody Has Done
Now comes the part that makes this study extraordinary in hindsight. Let us trace every category forward.
The Fastest Wealth Creators: A Divided House
The ten fastest companies of 2011–2016 had one thing in common: explosive stock price appreciation over the previous five years. Nothing else. Some had passed the QGLP filter. Others had not. The results after 2016 were a perfect natural experiment in what QGLP actually predicts.
Bajaj Finance: The QGLP Archetype
In December 2016, Bajaj Finance had a market cap of ₹373 billion. Sixty percent CAGR over five years. Most analysts thought the growth was peaking.
Today, Bajaj Finance’s market cap is approximately ₹4 trillion — more than 10x its 2016 level, delivered over just nine years. That implies a sustained CAGR of roughly 34% from December 2016 onwards, through demonetisation, the NBFC crisis of 2018, Covid, and three RBI governor changes.
Why? Because Bajaj Finance scored near-perfect on QGLP. Quality of business: India’s dominant consumer lending franchise, a monopoly in specific retail segments. Quality of management: Rajeev Jain built one of the most analytically rigorous risk management systems in Indian financial services. Growth: India’s formal credit market was structurally underpenetrated. Longevity: switching costs in lending relationships are real and durable. Price in 2016: at P/E of 29x, it was not cheap — but it was pricing growth that actually arrived.
The Kelly insight: Bajaj Finance was a big bet situation. Edge (proprietary understanding of the underpenetration thesis) + asymmetric payoff (massive upside, limited downside given business quality). Those who applied the CAP framework and sized it meaningfully made life-changing returns.
Vakrangee: When Q = 0, Nothing Else Matters
Vakrangee delivered a 63% CAGR during 2011–2016. It rode India’s digital India and e-governance narrative, setting up rural kiosks to deliver banking, insurance, and government services in underserved areas. The market loved the story.
By January 2018, the stock had climbed further — to ₹515 per share, making it a 1,000-bagger from its lows. Then, in a single month, it fell from ₹515 to ₹36. The trigger: a wave of auditor resignations. More than 30 auditors resigned in six months. What followed was one of the most spectacular corporate implosions in Indian market history.
The QGLP post-mortem is instructive. Quality of management was the failure point. There were red flags as early as 2014–2015 — unusually high promoter pledging, aggressive accounting for franchise network numbers that could never be independently verified, and a business model that relied heavily on government contracts without transparent operational data. Investors who applied a rigorous Q-filter would have stayed away. Those who saw a fast-moving stock in a buzzing sector and allocated based on momentum paid the price.
The Kelly lesson: without edge (you did not actually know the business was sound), you had no business making a large allocation, regardless of what the price chart said.
Welspun India: Quality Breaks At The Seams
Welspun India’s 88% CAGR between 2011 and 2016 put it at the very top of the fastest list. India’s largest home textiles exporter. Major supplier to Target, Walmart, and Bed Bath & Beyond in the United States. Revenues of ₹55 billion by 2016.
The collapse came in August 2016 — the same month the study was in final preparation. Target Corporation announced that it had discovered Welspun had been selling sheets labelled as Egyptian cotton that contained none at all. The contract, worth approximately ₹7 billion annually, was terminated immediately. Walmart followed. The stock lost 42% of its market value in three days, wiping $740 million off the balance sheet.
The QGLP analysis reveals the fault line: Quality of Management. The mislabeling was not an accidental supply chain error — it was a deliberate, sustained substitution over nearly two years. This is a governance failure of the most fundamental kind. A company willing to defraud its largest customer for margin improvement has a management team that will, when sufficiently pressured, defraud its investors too.
The business was fine. The management was not. Q = 0. The study’s framework, applied rigorously, would have caught this.
Ajanta Pharma: The Good Business That Hit Its Longevity Wall
Ajanta Pharma delivered 121% CAGR between 2011 and 2016. At ₹2x per share in 2011, it was one of the most explosive wealth creators in Indian pharma history. The thesis was straightforward: a focused niche pharma company growing aggressively in branded generics in Asia and Africa, away from the brutal US generics price war that was destroying bigger players.
After 2016, the stock essentially stagnated for three years. From a peak near ₹2,000 in 2016–2017, it traded sideways until 2019. The business continued to grow — revenue and earnings kept compounding — but the market had re-rated the growth prospects. The high-growth, low-competition window in African and Asian markets began to narrow. Competitors caught up with similar product strategies. The Longevity component of QGLP was being questioned by the market.
By 2025, Ajanta Pharma’s market cap sits at roughly ₹372 billion — about 3x its 2016 level, representing a CAGR of approximately 13–14%. Respectable. But nothing close to the 121% of the preceding five years.
The lesson: Longevity is the hardest part of QGLP to assess. When a company’s growth runway is long, the rewards are extraordinary. When the runway is shorter than expected, even a genuinely good business delivers mediocre stock returns because the high growth premium built into the valuation never fully materialises.
The Consistent Wealth Creators: A Different Story Entirely
Now compare the fastest list to the consistent list. Asian Paints, HDFC Bank, Titan, Kotak Mahindra Bank — these names appeared in 10 consecutive Wealth Creation Studies between 2006 and 2016. Not the flashiest names. Not the ones generating cocktail party conversation.
Asian Paints compounded from roughly ₹250 in 2016 to over ₹2,500 by 2022 — a 10x return over 6 years — before recent headwinds from Birla Opus competition. Titan tripled, then tripled again. Kotak continued its quiet compounding. These were the stocks that appeared average in any given year but extraordinary over any meaningful time horizon.
The QGLP observation: all of these companies scored high across all four criteria, consistently. The Longevity was real — brands, distribution networks, and customer loyalty take decades to build and are nearly impossible to replicate quickly.
Part 8: The Most Counterintuitive Finding
Now here is the twist that makes this whole exercise genuinely surprising.
Look at the Wealth Destroyers of 2011–2016: NMDC (–19% CAGR), BHEL (–23%), ONGC (–6%), Jindal Steel (–39%), SBI (–7%), NTPC (–8%), SAIL (–24%).
These were labelled wealth destroyers. They were commodity companies, PSUs, and cyclicals in a down cycle. Conventional wisdom said stay away.
What happened to them after 2016?
NMDC — ranked #6 on the Most Consistent Wealth Creators list in the 2024 Wealth Creation Study with a 26% CAGR over 2019–2024. From destroyer to consistent creator.
Jindal Stainless — ranked #3 Fastest Wealth Creator in 2019–2024 with a 77% CAGR. The same company that was a top wealth destroyer in 2011–2016 became one of the ten fastest wealth creators in India over the subsequent five years.
SBI — ranked #5 Biggest Wealth Creator in 2019–2024. India’s largest bank, once dismissed as a permanently broken public sector institution, created ₹4.176 trillion in shareholder wealth in the five years to 2024.
What changed? Not the companies. The cycle changed. Commodity prices recovered. Credit cycles turned. India’s infrastructure spending boom created demand for steel, energy, and mining output. The Bruised Blue Chip dynamic (discussed in the 29th Study) applied perfectly: these were quality businesses in a down cycle, not structurally impaired businesses. Those who bought them at the depths of the 2016 pessimism made extraordinary returns.
The 21st Study’s framework did not specifically flag these as buys. But it contained the tools to see them clearly: a business that scores highly on Q (proven track record, dominant market position) but is currently suffering on G (cyclical earnings decline) and trading at deeply depressed P is exactly the high-asymmetry, analytical-edge situation where Kelly says: bet big.
Part 8.5: The Study’s Hidden Forward-Looking Signals
The 21st Study is primarily a retrospective — it looks backward at 2011–2016 data. But scattered throughout the data section were several implicit forward-looking signals that, if you were reading carefully, pointed clearly at what was coming next.
Most readers missed them. Here they are, with the benefit of nine years of hindsight.
Signal 1: The PSU Contrarian Call
In Section #7 (Ownership Analysis), after cataloguing how PSUs had been catastrophic wealth destroyers with only 4% of total wealth created, the study included a Key Takeaway that read almost like a contrarian buy thesis:
“Can industrial recovery and government focus lead to mean reversion for PSUs? Fortunes of many PSUs hinge on performance of the economy, especially the industrial sector — Coal India, BHEL, SBI, SAIL, etc. Measures to boost industrial recovery — ‘Make in India’, rate cuts — bode well for the fortunes of such PSUs. Further, the government too is focused on reviving PSUs e.g. merger of SBI associate banks. These, coupled with low valuations of PSUs, hold the potential to trigger mean reversion in Wealth Creation by PSUs.”
This is extraordinary in retrospect. The study was identifying the exact set of companies that became the next decade’s outperformers. The 29th Annual Wealth Creation Study (2024) confirmed the reversal dramatically: SBI (#5 Biggest), NMDC (#6 Consistent Creator), Jindal Stainless (#3 Fastest). The PSU mean reversion trade was implicit in the 2016 data — and the study explicitly flagged it.
Signal 2: The Hidden Gem List
Section #10 of the study is titled “Those Who Missed the List” — specifically a sub-section on “The Fast Who Didn’t Make It Big.” These are companies that delivered strong 5-year price returns but were too small by market cap to qualify for the top 100. It is, in effect, a hidden watchlist of tomorrow’s wealth creators.
Top of the list: Solar Industries at 43% CAGR for 2011–2016, with only ₹52 billion in wealth created — too small. The stock was trading around ₹800 in December 2016. Here is what happened next:
Solar Industries pivoted from industrial explosives into India’s defence manufacturing revolution — rockets, propellants, composite materials, drones
The stock hit an all-time high of ₹17,820 in June 2025
That is a 22x return in under 9 years from the date of the 21st Study
The rest of that hidden list was equally compelling:
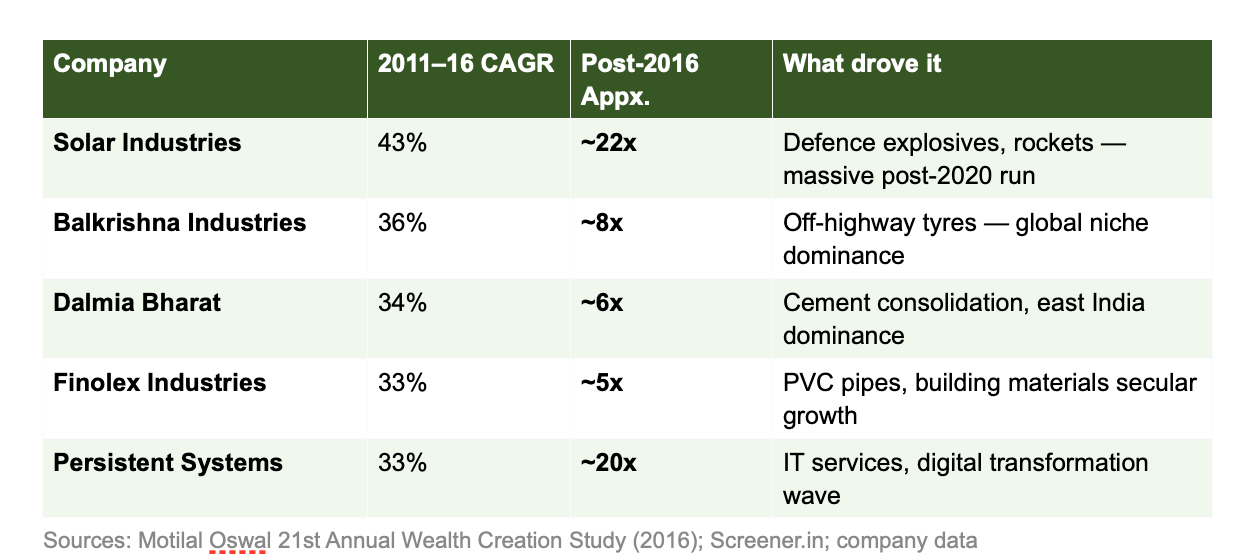
The QGLP filter would have helped select from this list. Solar Industries had strong Q (niche business, government client, professional management), genuine G (defence spending secular rise), credible L (once you hold a government explosive supply contract, you hold it for decades), and at ₹800 in late 2016, an extremely attractive P.
Signal 3: The Mini-to-Mid Pattern as a Hunting Framework
Section #8 analysed market cap crossovers. During 2011–2016, 67 companies moved from Mini to Mid category, generating an average 39% CAGR versus 5% for the Sensex. The study’s Key Takeaway was simple: “Mid category: A good place to hunt for Wealth Creators.”
This structural observation has held true in every subsequent study period. Small companies in large addressable markets with honest management and capital discipline consistently punch above their weight. The framework for finding them hasn’t changed.
Part 9: Applying the Framework to 2026 — A Focused Investor’s Lens
So where does this leave us today?
India’s markets have corrected meaningfully from their September 2024 peaks. The Nifty is off roughly 12–15% from highs. Small and mid-cap stocks have seen deeper cuts. FII outflows have been significant. Earnings growth momentum has slowed in several sectors.
In short: this is the environment the Focused Investing framework was designed for. Prices are more attractive. The noise is louder. And the temptation to diversify into safety and mediocrity has never been stronger.
Here is how I am thinking about building a focused portfolio using the QGLP + CAP lens in 2026:
The Q-filter first. Before you look at a chart or a price, ask: is this business one I would want to own privately for a decade? Does the management have a long, verifiable track record of honest capital allocation? In India’s market right now, several sectors pass this filter readily — private banking, select consumer brands, IT services companies, and healthcare businesses with deep R&D moats.
Then G — but assess the longevity of G. India’s credit cycle is in the early-to-middle stages of a structural expansion driven by formalisation, digitisation, and a rising middle class. Companies with exposure to this secular G — consumer lenders, insurance, wealth management — have a long runway. Capital goods and manufacturing businesses riding the PLI and infrastructure capex cycle also have genuine G, but the cycle-dependence of G needs to be assessed honestly.
L is the differentiator. In a market where nearly everything looked like it had runway in 2022–2023, L is now the test that matters. Which of the growth companies actually have durable competitive advantages — and which were simply beneficiaries of a liquidity-driven expansion in multiples? Businesses with genuine moats — proprietary technology, deep distribution, regulatory protection, or brand pricing power — will sustain their CAP through the next cycle. The others will disappoint.
P — now, finally, is more interesting. After two years of elevated valuations, several genuinely quality companies are available at prices that represent fair-to-attractive value. The QGLP checklist-passers that were untouchably expensive at 70–80x earnings are at 40–45x. Not cheap — but the long-term compounder math starts to work at these levels.
For position sizing — the CAP discipline. The stocks where you have highest conviction across all four criteria get your largest allocations. Where you have high Q and G but are uncertain about L, you still hold the position but at lower weight. Where price is compelling but Q is questionable, you stay out — no matter how good the chart looks.
A hypothetical focused portfolio for 2026 might look like: 3–4 private banking positions anchoring the portfolio at 35–40% combined weight; 2–3 consumer discretionary names (aspirational India, not FMCG defensives) at 20–25%; 2 IT services names with genuine transformation exposure at 15–20%; 1–2 healthcare names with strong domestic branded generics at 10%; and optionally, 1–2 manufacturing/capital goods names for cycle exposure at 10%. This is 12–15 positions — squarely in Focused Investing territory.
The critical discipline: do not add to the portfolio just to diversify. Each new position must earn its place by either improving the portfolio’s expected return or genuinely reducing a correlated risk. Adding a 16th position because the market just corrected a random sector is not diversification — it is the expensive illusion of safety.
Part 10: The Meta-Lesson
Looking back at December 2016 — in the middle of demonetisation chaos — the 21st Study’s most important message was not about specific stocks. It was about process.
The investors who outperformed over the subsequent nine years were not those who happened to be in the right sector. They were those who:
Maintained a clear portfolio goal (outperform meaningfully, not beat by 1–2%)
Applied a rigorous quality filter before any analysis of price or momentum
Sized their best ideas at meaningful weights — not hidden at 1–2% each
Monitored their holdings actively and updated their thesis honestly when facts changed
Bajaj Finance rewarded those who ran this process. Vakrangee punished those who skipped step 2. Welspun India reminded us that even past performance cannot substitute for present governance assessment.
The 2016 study was titled “Power of Allocation in Wealth Creation.” But the deepest insight was simpler: process is the only sustainable edge.
Charts do not tell you whether management will defraud their customers. Momentum does not tell you whether a growth story has three years of runway or fifteen. Only genuine analysis — the kind that produces real conviction, not just a comfortable reason to buy — creates the foundation for a meaningfully sized position that you will hold through volatility.
That is the Focused Investor’s advantage. It is not a clever formula. It is the patience to do the work, the discipline to apply the filter, and the conviction to size accordingly when both Q and asymmetry align.
We are in one of those moments right now.
Data Sources: Motilal Oswal 21st Annual Wealth Creation Study (December 2016); Motilal Oswal 29th Annual Wealth Creation Study (December 2024); Screener.in; company annual reports.
⚠️ This post is for educational purposes only and does not constitute investment advice. The companies mentioned are for illustrative purposes and analysis of historical data. Please do your own research and consult a SEBI-registered financial advisor before making investment decisions.
If this was useful, forward it to one serious investor in your circle. And if you have not already hit subscribe below. This is the kind of work we do here every week.