US Tech Momentum
Test results
Over the past two months, we ran a focused momentum strategy on a curated list of US-origin internet and tech companies. The rules were simple:
Buy when momentum turned positive ("Yes"), and either exit on a momentum loss ("No") or hold if strength persisted.
Let’s see how that strategy stacked up against the mighty S&P 500 during the same period.
All of this based on our in house indicator
The Timeline
Start Date: May 9, 2025
End Date: July 6, 2025
S&P 500 Return: +6.2%
Our Strategy (Avg. Unrealized Return per Trade): +10.7%
What We Did
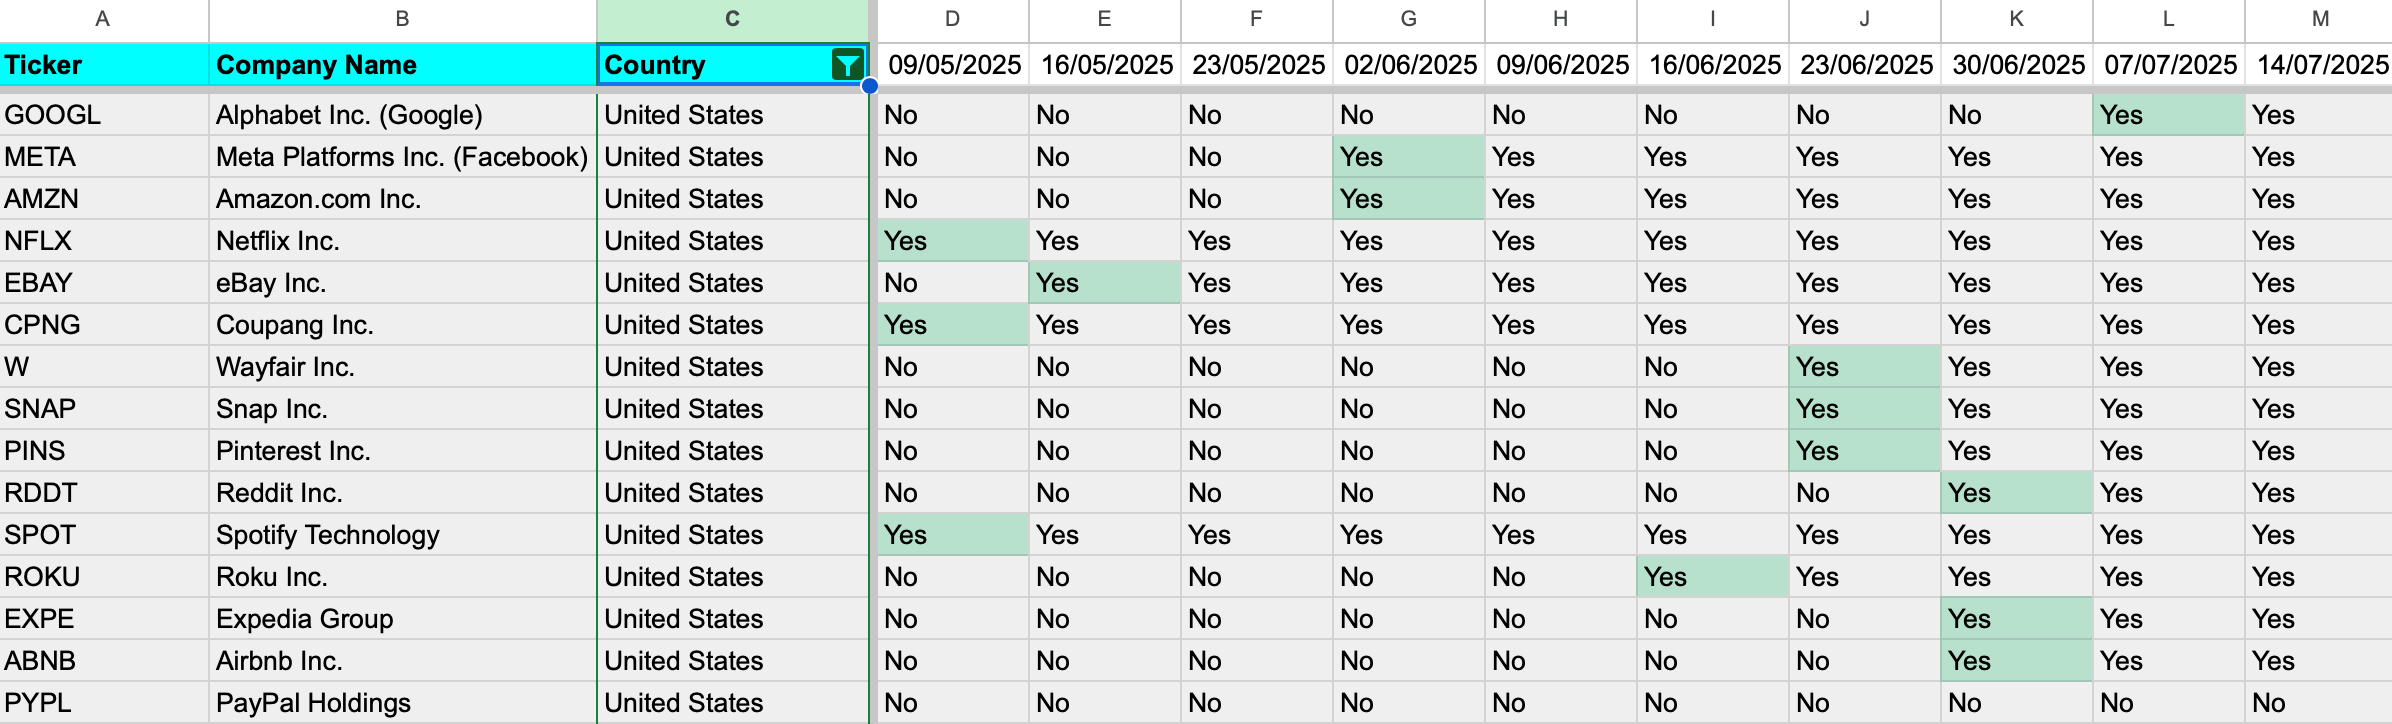
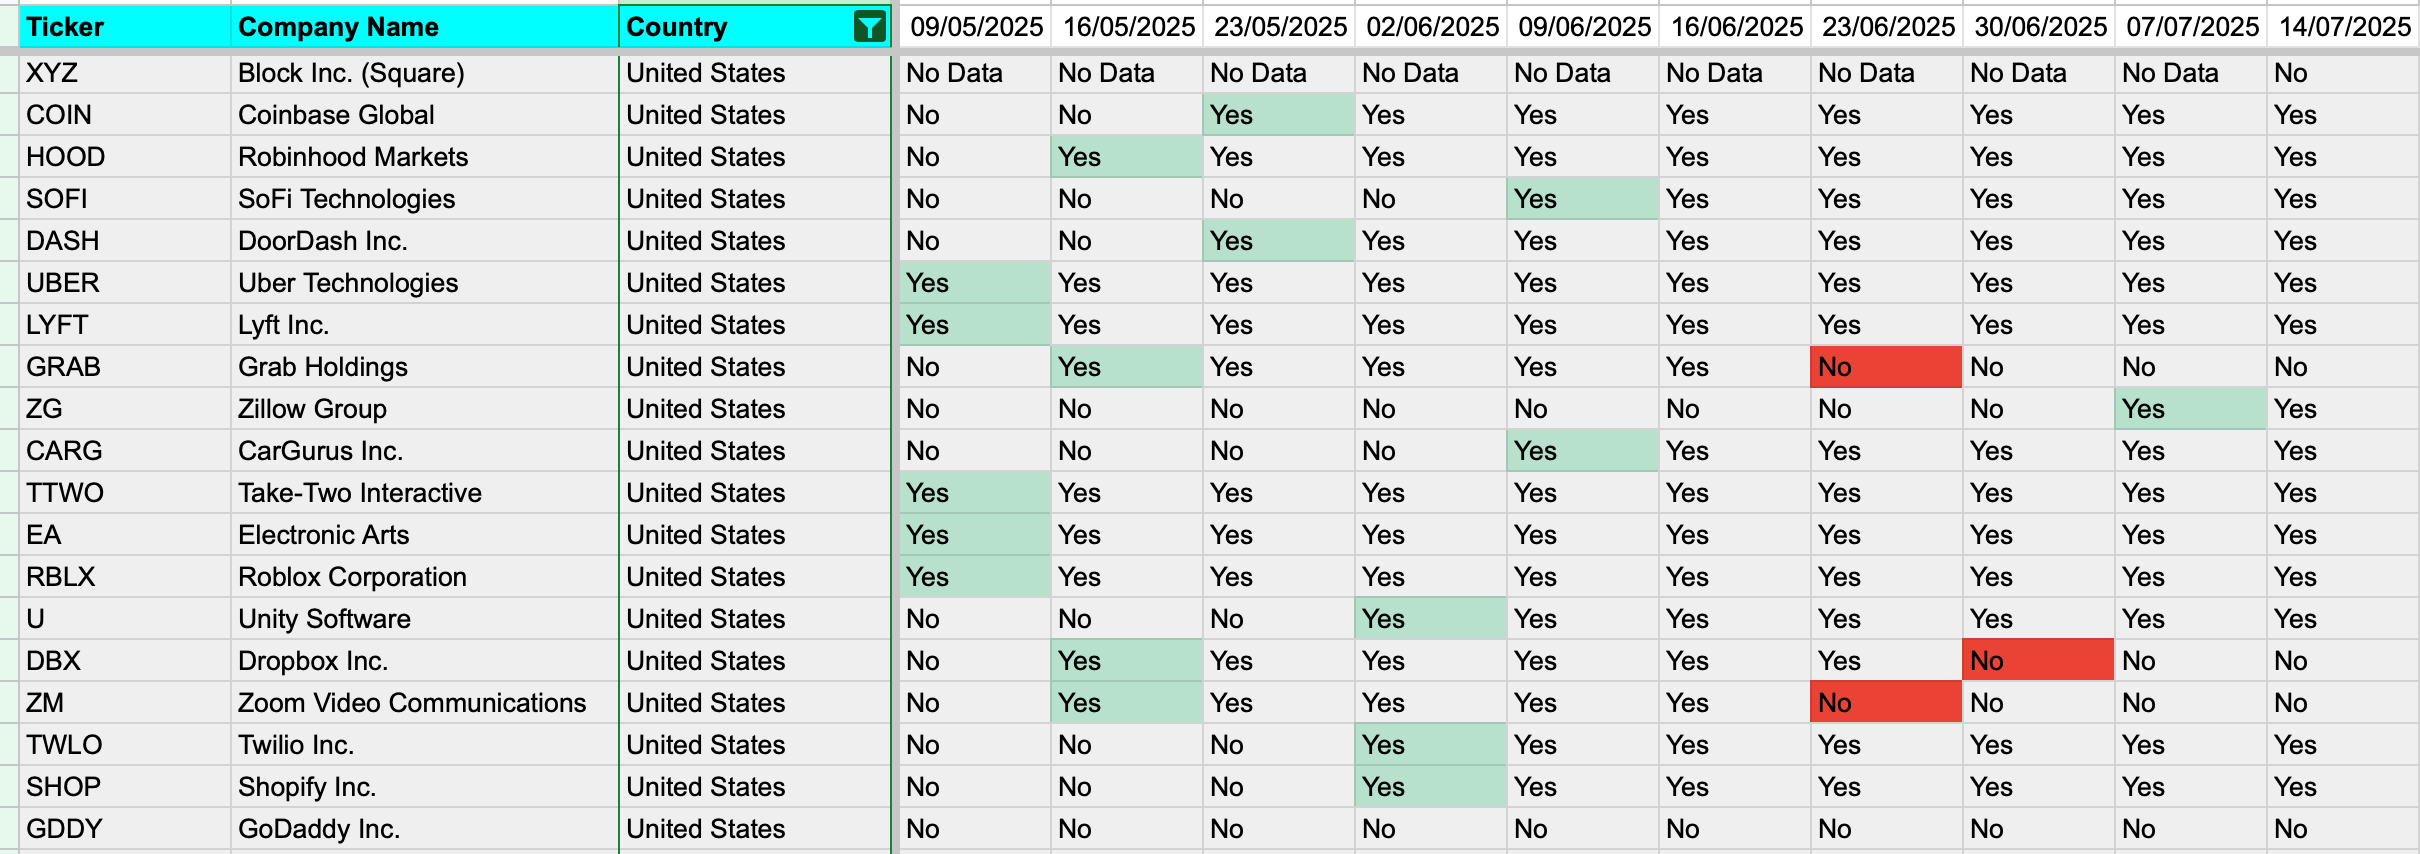
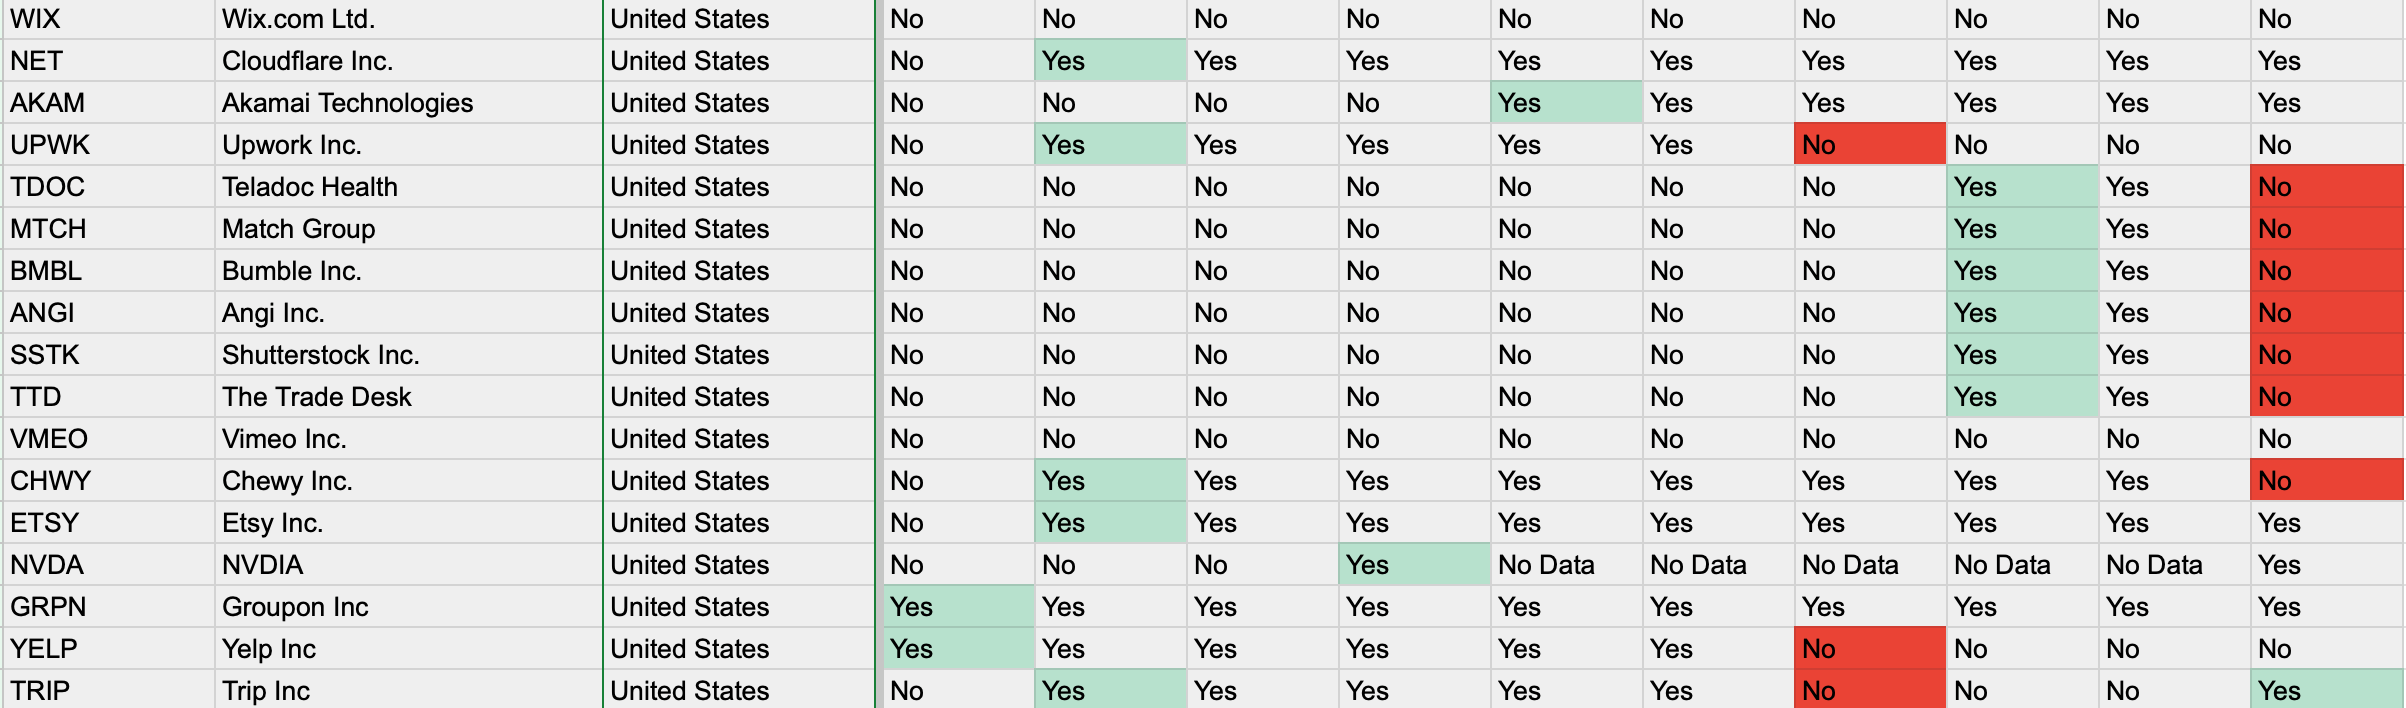
We applied our signal-based model to over 60 US-origin stocks, identifying entries and exits using weekly momentum signals. Each trade’s return was calculated using actual historical prices, falling back to the nearest available trading day when needed (e.g., using May 30 if June 2 price wasn't available).
Why It Worked
Several reasons explain the outperformance:
Concentrated Picks: We avoided index laggards and focused on digital growth stocks.
Momentum-Based Entries: Rather than timing the market, we followed the trend.
Active Filters: Stocks without a strong signal stayed out avoiding churn.
Things to Keep in Mind
This wasn’t a buy-and-hold strategy it was signal-driven and required weekly updates.
Transaction costs and taxes aren't accounted for.
Momentum strategies can underperform in sideways or choppy markets.
So, Did We Beat the Market?
Yes for this period, and for this specific segment.
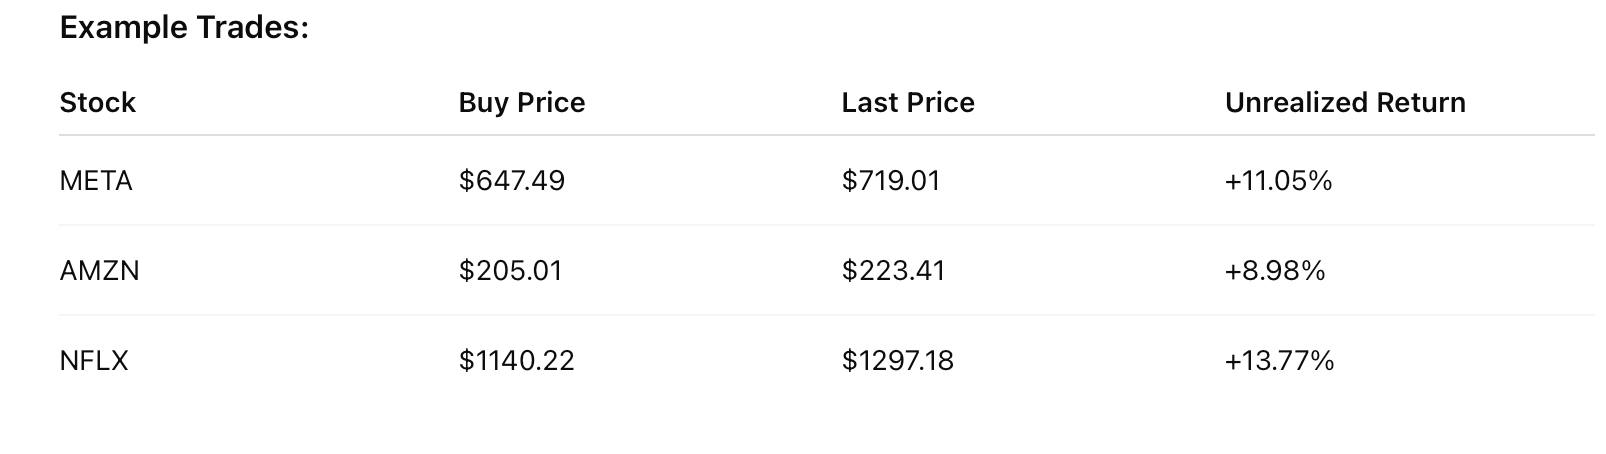
Our model captured some stellar trends early (Netflix, Meta) and avoided some deadweight. While +10.7% vs. +6.2%might not look like a huge spread, on an annualised basis that difference compounds meaningfully
Want to See This Strategy in Action?
Do it yourself - get the code and run it your self every week
if there is enough interest we will be setting up a US tech momentum newsletter , leave a comment or like and we will know the interest
dashboard view on 14th