Value Investing on Steroids
Experiment with backtest
Got a weird idea while on long commute to workplace!
I was thinking what if we coat tail one of the most respected value investors in India but instead of taking positions in equity we take positions in futures and back tests results
So that’s what I did.
I took the disclosed holdings of Parag Parikh Flexi Cap Fund (PPFAS) from 2013 onwards, and built a simple rules-based backtest:
Whenever PPFAS discloses a stock in its factsheet, go long 1 futures lot.
Hold it until the first factsheet where that stock disappears.
Rinse and repeat for every F&O eligible stock.
The results were… surprisingly good.
1. Data source
Fund: Parag Parikh Flexi Cap Fund (PPFAS)
Period: June 2013 – October 2025
Source: Fund factsheets (the regular PDF holdings disclosures on the AMC website)
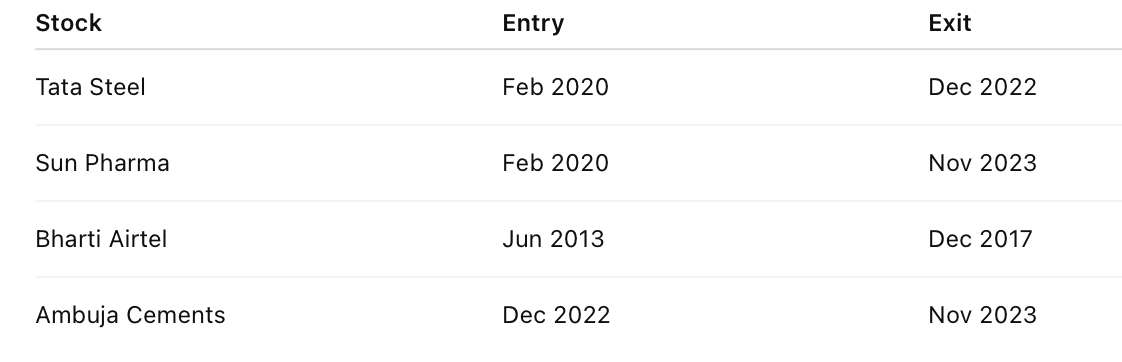
From those factsheets I built a list of:
Stock name
Entry month (first month it appears in the portfolio)
Exit month (month after which it stops appearing)
Example
2. How entries and exits are dated
For each position:
Parse
Entry_Monthlike“February 2020”Parse
Exit_Monthlike“December 2022”
Then convert them into trading dates:
Entry_Date = 1st calendar day of the next month
e.g. Feb 2020 → entry effective 1st March 2020 (first trading day after that)
Exit_Date = 1st calendar day of the next month after exit month
e.g. Dec 2022 → exit effective 1st January 2023
During coding I then grabbed the first available trading day on or after that effective date from the price history.
3. Prices and tickers
Prices: Yahoo Finance daily data
For each stock, I mapped the name → Yahoo NSE ticker, e.g.:
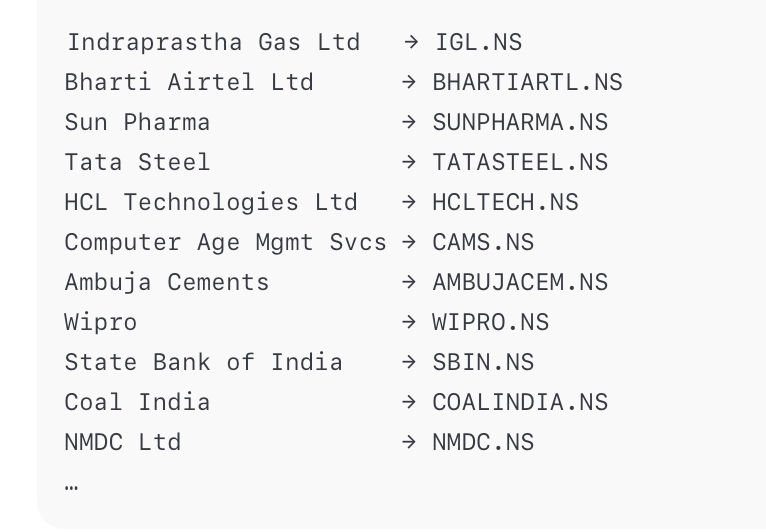
If Yahoo had no reliable data (delisted, pre-IPO, etc.), that stock was skipped.
4. Futures sizing (lot sizes)
To keep things simple and more “today-realistic”:
I used current F&O lot sizes (as of late 2025) for each F&O name.
Example lot sizes used:
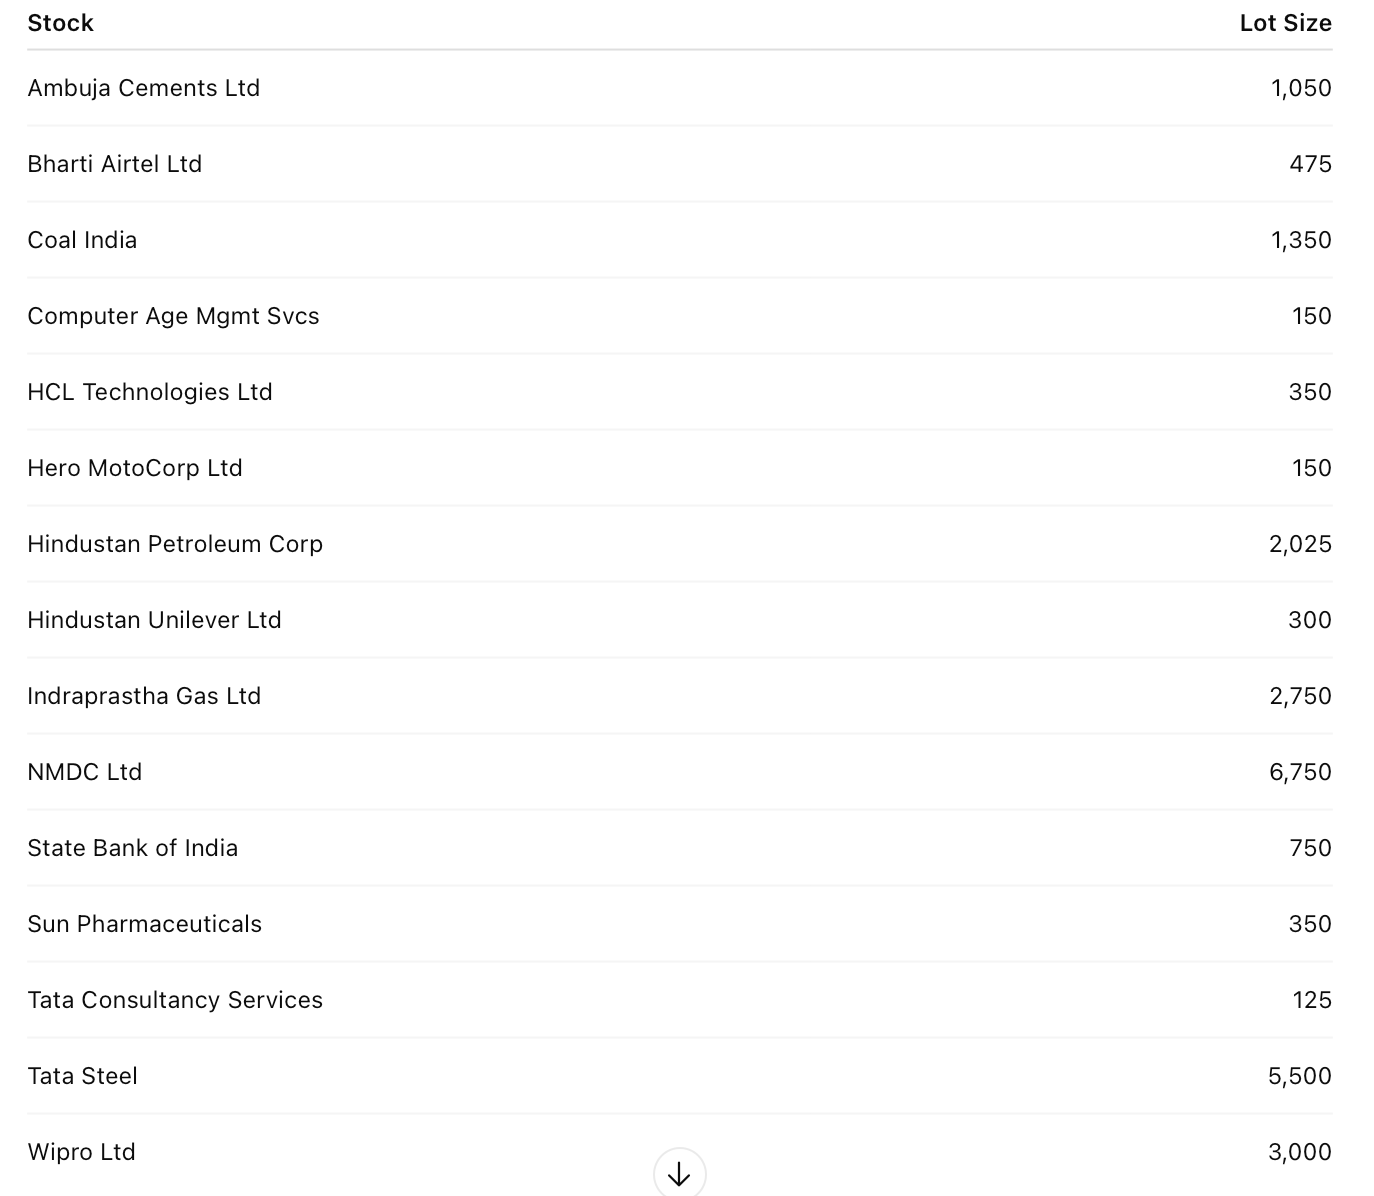
All other stocks (that are not in F&O now) were excluded from the F&O backtest.
5. PnL calculation
For each F&O trade ,No costs, no taxes, no roll slippage, nothing. This is a signal purity test
From the filtered data:
Number of F&O trades:
16Total F&O PnL (all trades combined): ≈ ₹18.97 lakh
Average PnL per trade: ≈ ₹1.19 lakh
Median PnL per trade: ≈ ₹1.17 lakh
Winning trades:
10Losing trades:
5
So roughly:
Win rate ~ 67% with decent average win size and manageable losses.
Best F&O trades
Here are the top 10 trades by futures PnL, using today’s lot sizes:
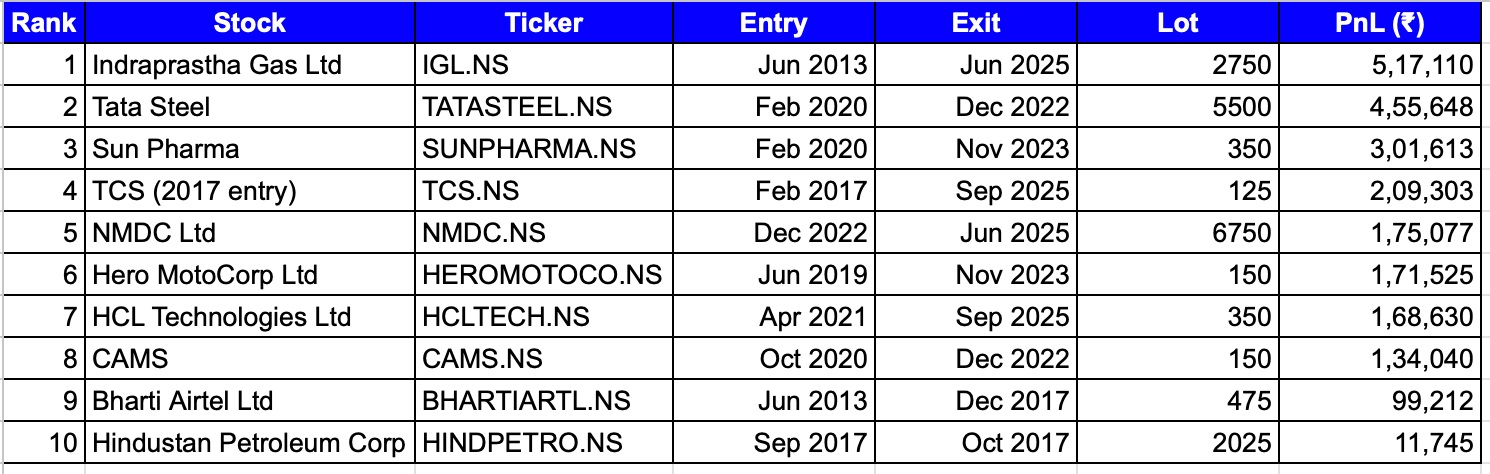
A couple of things stand out:
The early gas trade (IGL) and the Tata Steel post-COVID cycle are absolute monsters.
Long-term compounding in TCS, HCL Tech, Hero MotoCorp and Sun Pharma shows up beautifully when you add futures leverage.
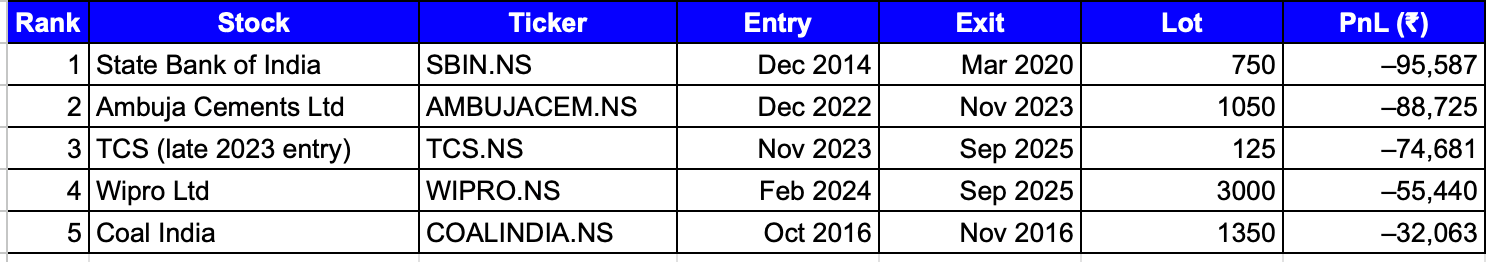
Worst F&O trades
And the downside
I also plotted a simple PnL per trade bar chart, sorted from best to worst:
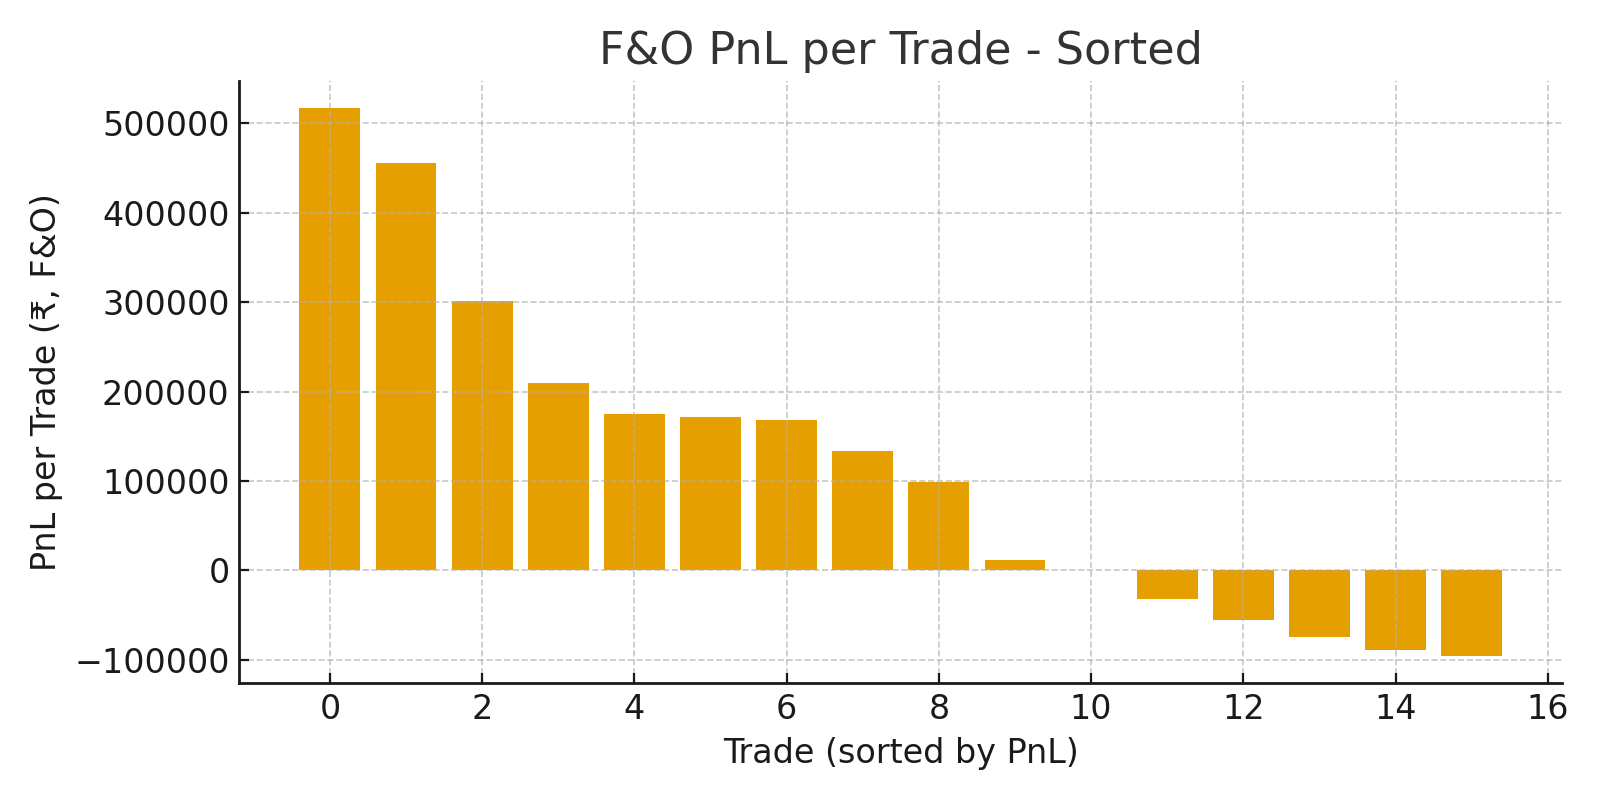
long right tail:
A few large winners carry the system.
Most trades are moderate winners.
A handful of losers are noticeable but not catastrophic.
code use for testing is available here
So… does “value investing on steroids” work?
On paper, with these assumptions: yes.
Coattailing a patient value fund like PPFAS
Using futures instead of cash
With simple “enter when disclosed, exit when removed” rules
…produced a positive, reasonably smooth PnL profile, powered by a handful of multi-year winners.
Would I run this as-is with real money?
No. Too many missing pieces: roll mechanics, risk limits, regulations, lot-size history, position sizing, and the small matter of sleeping at night while holding levered positions for years.
But as a thought experiment?
It shows how time + quality + leverage can combine into something much more powerful
If you enjoyed this support independent creators like me by becoming a paid subscriber
there could be errors as data is unstructured but the idea was to get a signal test, in next post we will look at their spot performance